
What if you could predict your next 90 days of revenue today?
Most brands wait for sales reports to understand how they’re performing. But by the time those numbers come in, the real signals have already happened. The truth is, the earliest and most reliable indicator of future revenue isn’t just tracking sales, it’s understanding customer movement. The flow of people moving between Engaged, Disengaged, Drop-Off, and At-Risk states can reveal exactly where your business is heading.

The Power of Customer Lifecycle Movement
Imagine being able to see 30 to 180 days into the future of your revenue. That’s what tracking customer lifecycle movement can do for you.
Your Predictive Window Based on Purchase Cycles
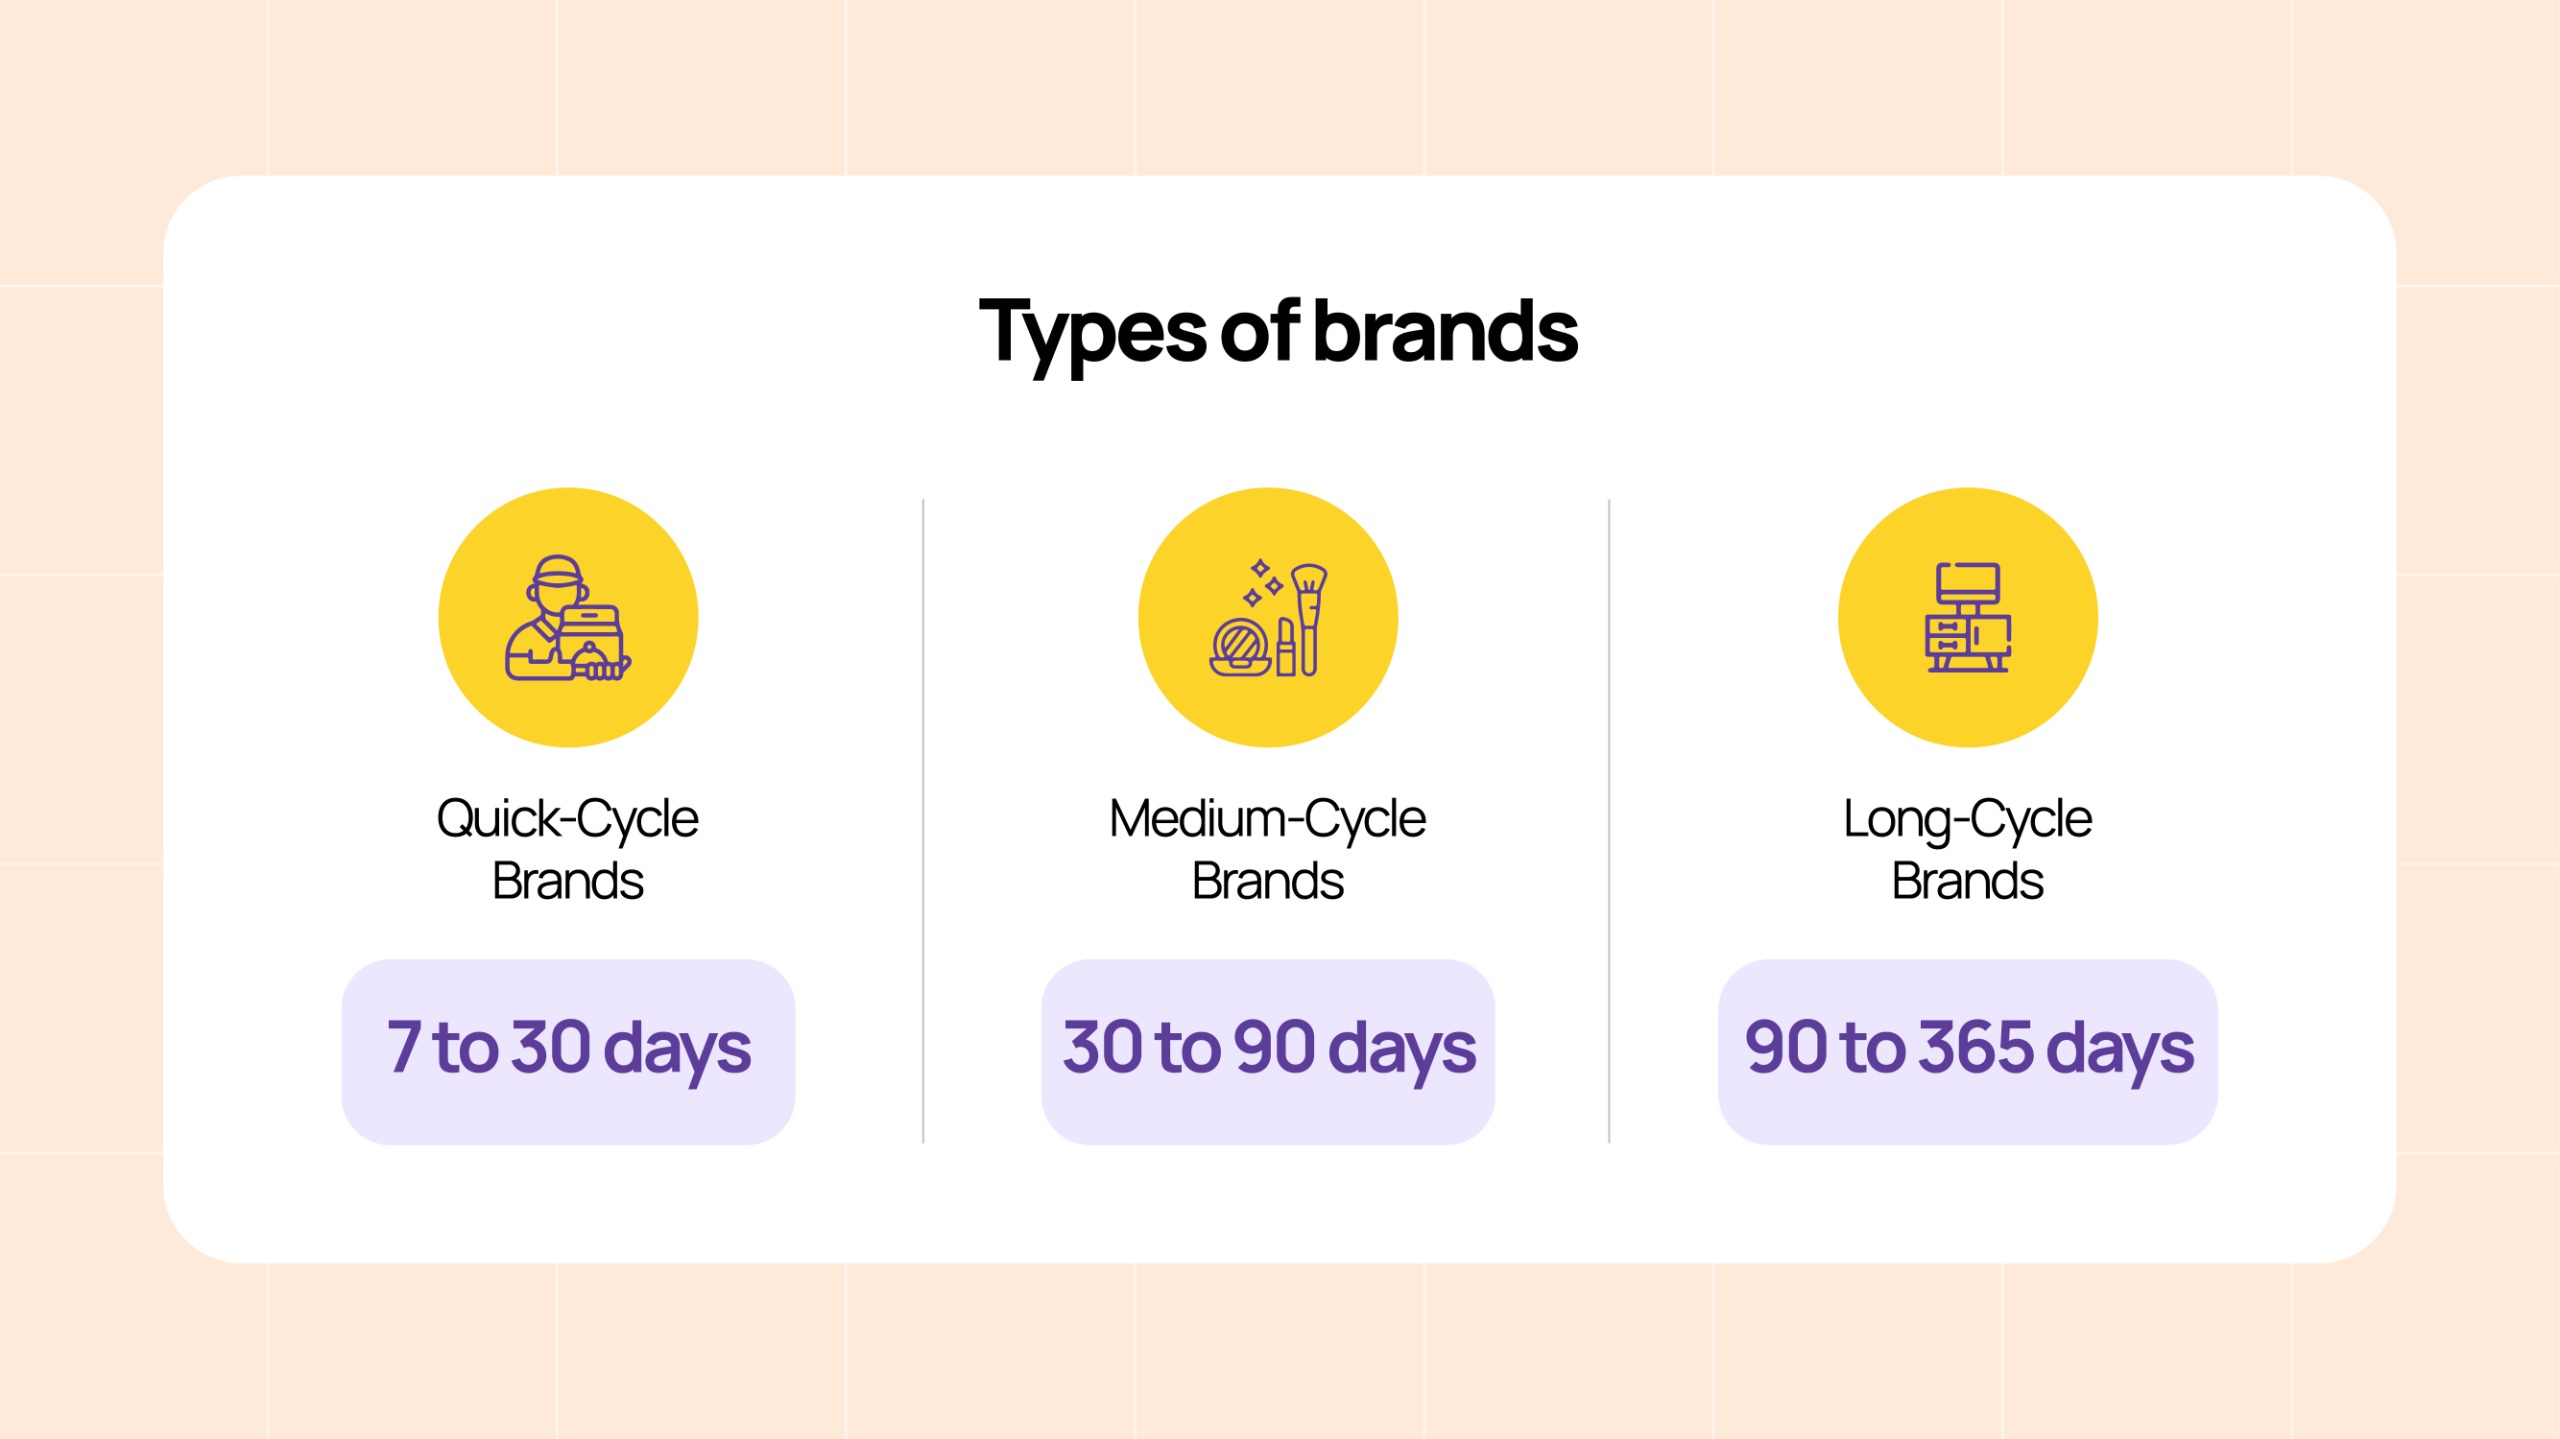
Every business operates on its own unique cycle. Here’s how it works:
- Quick-Cycle Brands (7 to 30 days)
- Impact visible in just 4 to 8 weeks
- Think: food delivery, ride-sharing, and quick purchases
- Impact visible in just 4 to 8 weeks
- Medium-Cycle Brands (30 to 90 days)
- Impact visible in 8 to 12 weeks
- Think: fashion, beauty, DTC supplements
- Impact visible in 8 to 12 weeks
- Long-Cycle Brands (90 to 365 days)
- Impact visible in 12 to 24 weeks
- Think: furniture, electronics, and B2B SaaS
- Impact visible in 12 to 24 weeks
In short, your predictive window is typically two to three times your purchase cycle. The longer the cycle, the more time you have to react.
Three Customer Movement Patterns That Reveal Your Revenue Direction
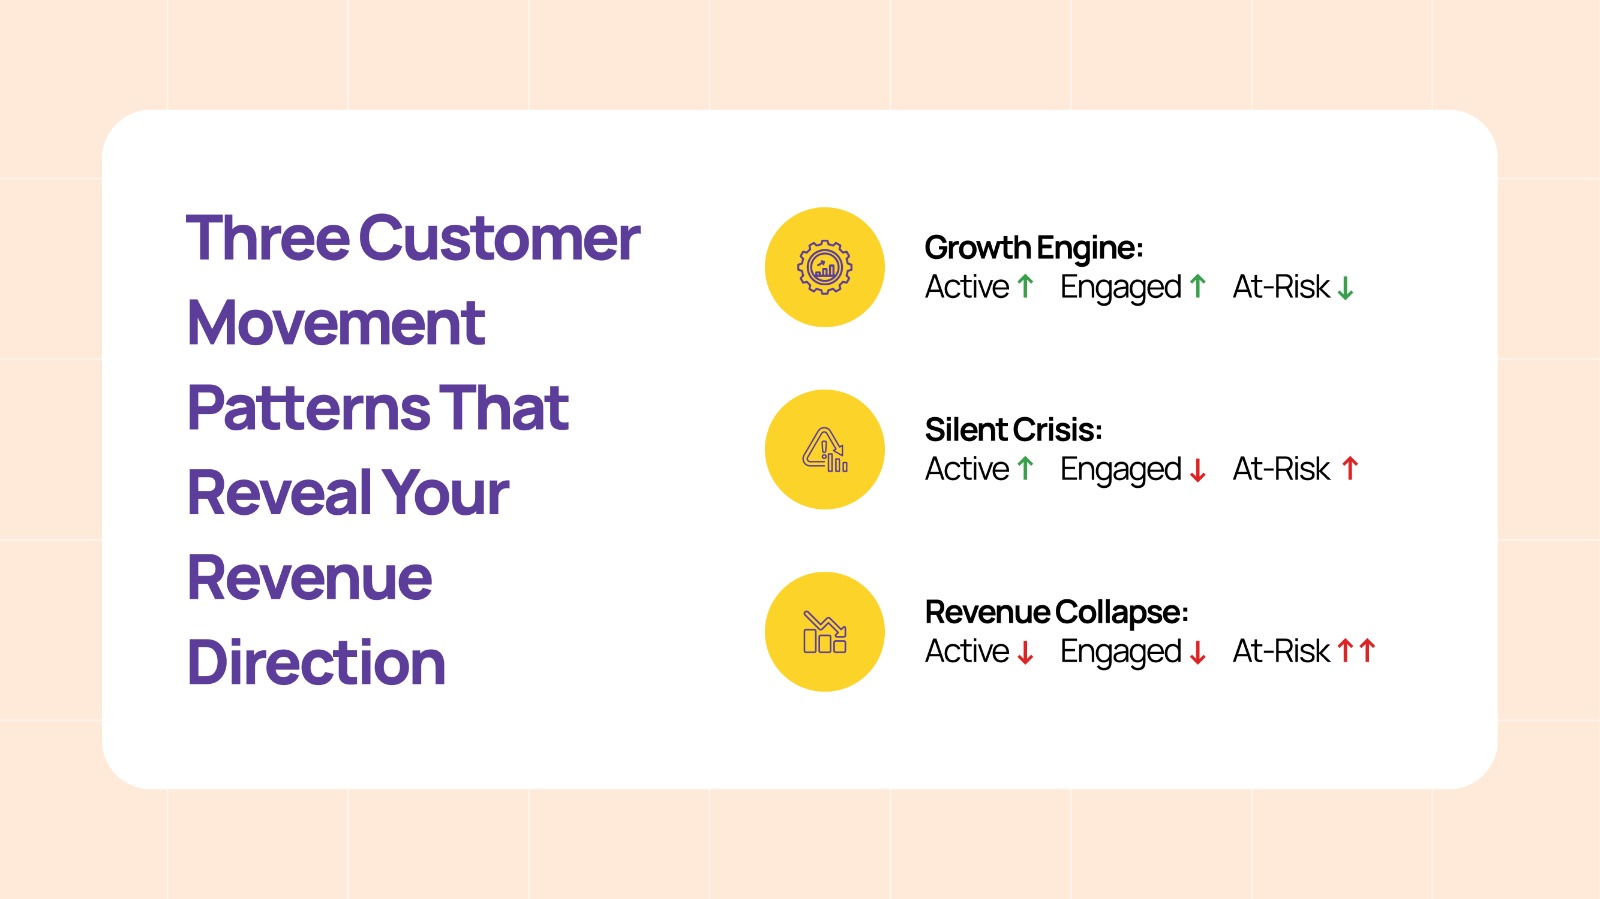
1. Growth Engine
- Active ↑
- Engaged ↑
- At-Risk ↓
What it means: Your business is growing! You’re acquiring high-quality customers, and retention is strong.
Outlook: Revenue is headed upward, and you should focus on scaling what’s working.
2. Silent Crisis
- Active ↑
- Engaged ↓
- At-Risk ↑
What it means: You’re getting customers, but they’re not staying. Poor onboarding or engagement is likely to blame.
Outlook: Short-term growth, but watch out for long-term decline if this continues.
Action: Improve customer onboarding and engagement to get things back on track.
3. Revenue Collapse
- Active ↓
- Engaged ↓
- At-Risk ↑↑
What it means: Fundamental retention issues are at play. You’re losing customers fast, and your churn is rising.
Outlook: Expect a significant revenue decline ahead if things aren’t fixed as soon as possible.
Action: A retention overhaul is urgently needed.
Using Movement Formulas to Predict Your Revenue
Now, let’s turn all that movement into actionable numbers.
- Quick-Cycle (30 Days)
- Engaged contributes 70 to 90%
- Disengaged contributes 30 to 50%
- Drop-Off contributes 10 to 20%
- New contributes 20 to 40%
- Engaged contributes 70 to 90%
- Medium-Cycle (90 Days)
- Engaged contributes 60 to 80%
- Disengaged contributes 20 to 40%
- Engaged contributes 60 to 80%
- Long-Cycle (180 Days)
- Engaged contributes 40 to 70%
- Drop-Off contributes 2 to 8%
- Engaged contributes 40 to 70%
Multiply the projected active count by your average order value, and you’ve got your revenue forecast.
Early Warning Metrics to Keep an Eye On
Spotting trouble early can help you adjust before the damage is done. Here’s what to track:
- Engaged to Disengaged rising by 5 to 8%
- Active to Drop-Off rising by 10%
- Drop-Off to At-Risk rising by 12 to 15%
These shifts signal revenue changes 1 to 4 cycles before they hit your books. By paying attention to these movements, you can make smarter decisions and avoid bigger losses down the line.
Case Study: Brand X (Hypothetical Example)
Note: This case study is hypothetical and used here to show how these metrics work in practice.
Let’s take a look at Brand X, a subscription-based wellness brand, and explore how customer lifecycle movement influenced their revenue.
Business: Subscription-Based Wellness Brand (45-day cycle)
The Data:
- Month 1: Engaged 2,900 | Disengaged 900 | Drop-Off 400
- Month 2: Engaged 2,700 | Disengaged 1,100 | Drop-Off 700
- Month 3: Engaged 2,500 | Disengaged 1,300 | Drop-Off 1,000
Movement Spikes:
- Engaged to Disengaged increased 22%
- Disengaged to Drop-Off increased 35%
Forecasted Revenue Decline: 40%
Actual Decline After Corrective Measures: 18%
Revenue Protected: $360,000
A Simple Three-Week Plan to Predict Revenue
If this data is making your head spin, don’t worry. You can follow this simple 3-week plan to start predicting your revenue based on customer lifecycle movement:
Week One:
- Measure movement and set baselines
- Track how your customer states are shifting
Week Two:
- Apply prediction formulas and size the risk
- Understand how much impact each movement is likely to have on your revenue
Week Three:
- Run targeted retention and activation campaigns
- Address the areas where movement is problematic (like Engaged to Disengaged)
Where eWards and InsightX Help
With eWards, you don’t need to manually track these movements every month. Our platform tracks your customer shifts automatically, so you can focus on what really matters, your next best move.
- eWards tracks customer movement monthly
- InsightX highlights critical changes and revenue risks
- You get clear guidance on what to fix next
Ready to Predict Your Next 90 Days of Revenue with Confidence?
What if you could stop guessing and start predicting your next 90 days of revenue using real data? With customer movement analytics, it’s possible.
Book your free personalized session today and learn how to turn customer behavior into predictable, reliable revenue growth.
Read More : Parameter of the Week: Days Since Last Visit