
Chasing big spenders blinds you to the customers who keep your shelves moving. You assume the highest ticket tags in your POS mean loyalty, yet the day‑to‑day churn of modest spenders builds the real profit engine. Your POS Data Hides the repeat‑buyer signals that matter most.
Understanding the POS Data Gap in Repeat Buyer Detection
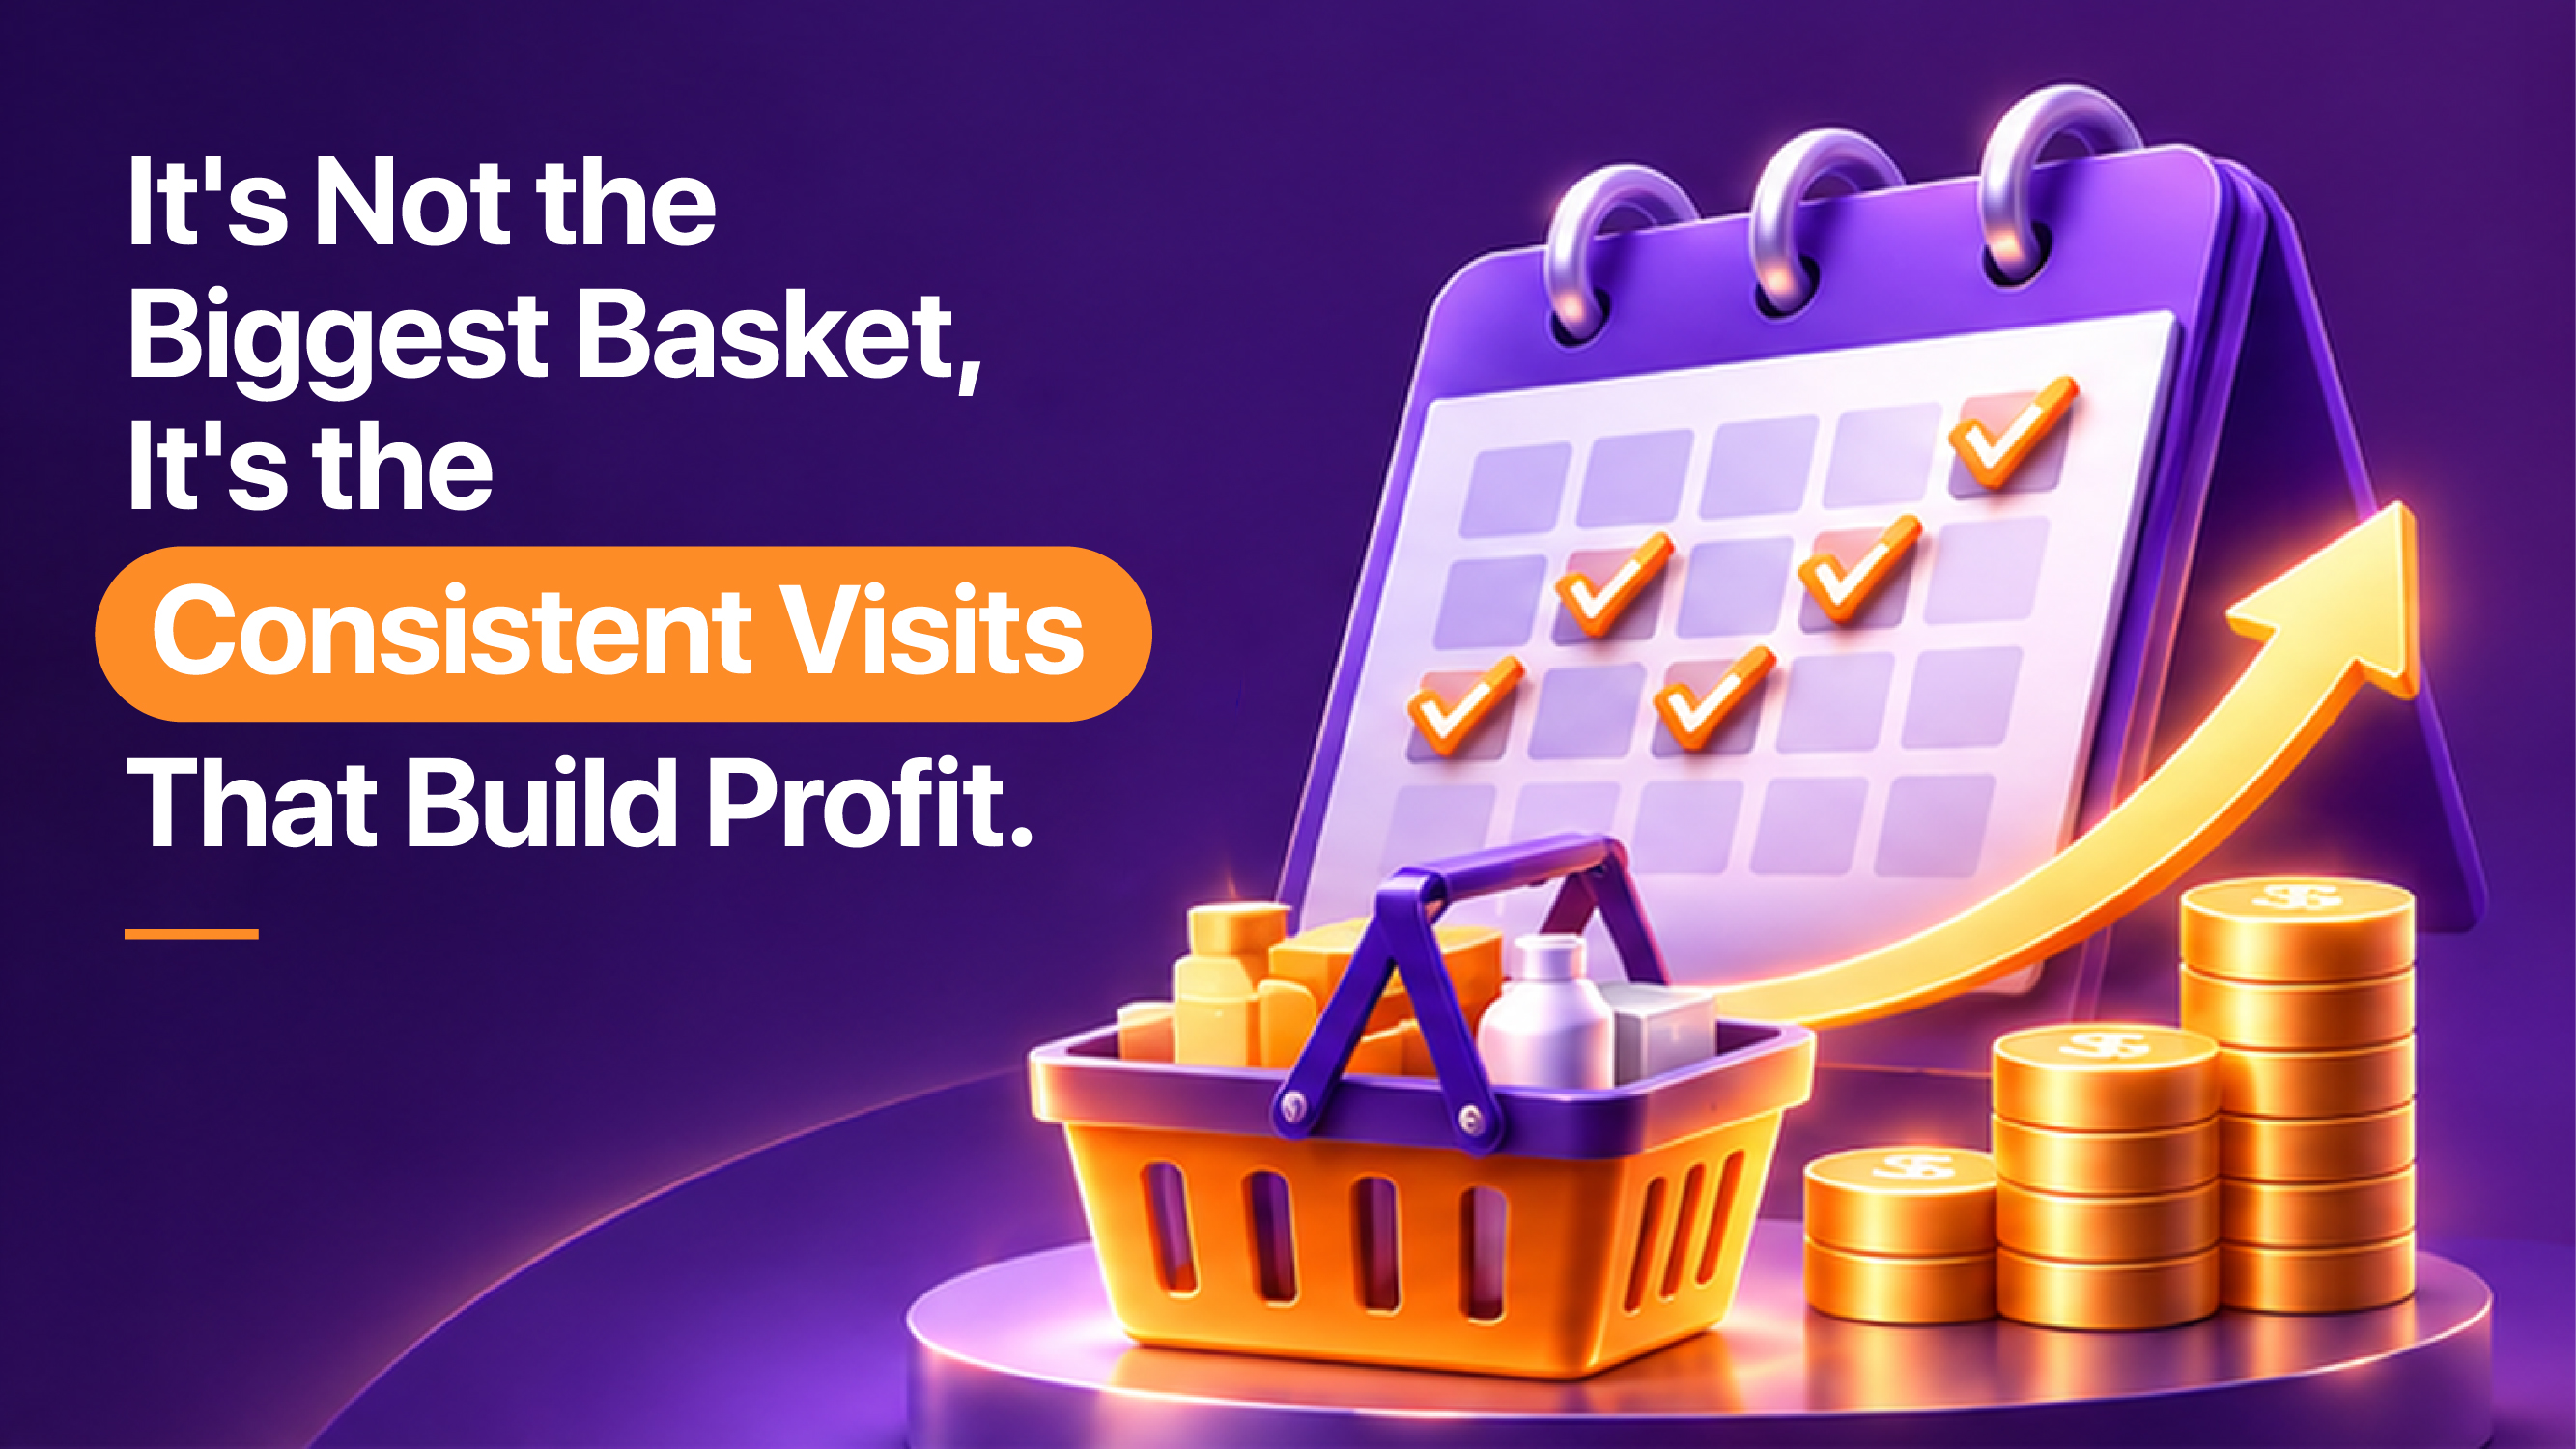
Your POS data hides the real repeat‑buyer because it only tells you what was bought, not how often the same shopper returns. A modest spender who visits weekly builds steadier revenue than a one‑off big spender. Look beyond ticket size and start counting visits. When you begin to treat each transaction as a chapter in a longer story, patterns emerge that were invisible when you looked only at the headline numbers.
When a cashier rings up a purchase, the system logs amount, items, and time—useful for inventory but silent on habit. The same high‑spend label can belong to a tourist who never returns, while a loyal family buying small items daily never gets flagged. Imagine the POS as a camera that captures a single frame; without a timeline, you cannot see whether the subject is walking by once or marching through the door every day.
Imagine a midsize fashion chain during the Diwali rush. The POS flags a handful of customers who bought expensive ethnic wear as “loyal”. Yet, after the season ends, those shoppers vanish. The system celebrated a spike that was tied to a cultural moment, not to an ongoing relationship.
Meanwhile, a neighborhood shopper who buys socks and tea every few days keeps the register humming all year. That shopper may never exceed a single transaction value that would trigger a “high‑spender” alert, but the cumulative impact of dozens of modest baskets is what smooths cash flow and cushions seasonal dips.
What the POS misses?
POS data captures the transaction, not the pattern. It records amount, but not the interval between purchases, nor links across store formats or channels. It also fails to capture the qualitative cues that signal intent—such as a shopper lingering in a particular aisle, or responding to a targeted in‑store message.
This blind spot drives retailers to chase high spend while neglecting the quiet engine of repeat visits. The real growth lever lies in spotting shoppers who return regularly, regardless of ticket size. By enriching raw POS logs with auxiliary data—loyalty card swipes, mobile app log‑ins, or even Wi‑Fi footfall identifiers—you can stitch together a more complete portrait of shopper frequency.
- Frequency: how many times a shopper shows up within a month. A shopper who steps in three times a week is a far more reliable revenue source than someone who spends twice a year on a single splurge.
- Consistency: visits across different locations. A brand‑wide loyalist may alternate between a flagship store and a suburban outlet, indicating brand affinity that transcends geography.
- Engagement: interaction with loyalty messages or app alerts. Opening a push notification about a new product line shows an active interest that can be nurtured.
- Seasonal balance: purchases of both festive and everyday items. A shopper who buys both a holiday gift and a weekly grocery demonstrates a holistic relationship with the brand.
- Channel mix: online and in‑store activity. A customer who orders online but picks up in‑store bridges the digital‑physical divide, offering more touchpoints for engagement.
To surface hidden repeaters, shift analysis from “who spent the most” to “who came back the most”. Group raw transaction logs by phone number or loyalty ID and count distinct visit dates. The list will highlight shoppers with a habit of returning, even if each basket is modest. You can further refine the list by adding a “recency” filter—prioritizing those who have visited within the last two weeks—to capture momentum.
Use that list to shape your loyalty program. Offer a small reward after a set number of visits instead of after a spend threshold. For example, a complimentary beverage after five store visits or a “buy‑nine‑get‑one‑free” coupon for a product category the shopper frequently purchases. Send a personalized note before the shopper’s next expected visit, highlighting a new arrival that matches past purchases. The note could reference the exact product type—“We noticed you love herbal teas, and a fresh blend just arrived”—which feels more relevant than a generic discount.
Embed repeat‑buyer analysis into regular reporting. Treat frequency count as a core KPI alongside revenue, and watch the steady stream of repeaters stabilize cash flow. Over time, you will see a correlation between the rise in repeat‑buyer frequency and a smoother, more predictable top line, even if average ticket size remains unchanged.
Action: Export last month’s POS transactions, group by customer ID, and count unique visit dates to identify true repeat buyers. Then, create a “Frequency Score” by dividing the number of visits by the number of weeks in the period; prioritize customers with a score of at least one visit per week for your next targeted campaign.
Why High‑Spender Tags Fail to Capture Loyalty?
High‑spender tags miss everyday shoppers who walk in week after week because they flag a big ticket once and ignore the steady flow that keeps cash registers humming. True loyalty lives in repeat visits, not occasional splurges. The high‑spender lens is akin to judging a book by the size of its cover illustration while ignoring the depth of its chapters.
What the data hides?
When the POS records a large basket, the system raises an alert—a one‑off snapshot. The next week the same customer may disappear, losing the chance to nurture a habit. The alert is often treated as a finished story, prompting a single thank‑you email that never follows up.
Meanwhile, a shopper who buys modest groceries every Saturday never triggers a high‑spend flag. Their monthly total may equal the big spender’s, but the POS treats them as ordinary traffic, leaving them out of loyalty programs. This oversight is especially pronounced in categories where purchase cycles are short—think coffee, fresh produce, or toiletries—where the cumulative spend builds slowly but reliably.
Focusing on spend spikes drives flash campaigns aimed at big spenders, while the true engine—regular footfall—slips by. These campaigns often require high margins to be profitable, eroding the very profit that high‑spenders seemed to promise.
Shift the lens to visit frequency. Track how often a customer steps through the door, not just how much they spend in a single trip. Patterns like weekly grocery runs, monthly beauty refills, or daily coffee purchases reveal the real repeat‑buyer cohort. By layering a temporal dimension onto the monetary data, you create a “Repeat‑Buyer Frequency Lens” that highlights the rhythm of shopper behavior.
Align promotions with these patterns to create personal moments—a reminder for a weekly grocery run, a nudge for a monthly salon appointment, or a thank‑you for a daily tea purchase. Small interactions build a habit loop that adds up to reliable revenue. For instance, a push notification that says “Your favorite latte is ready for pickup—enjoy a free pastry on your next visit” leverages the existing habit and adds a touch of surprise.
High‑spender tags also create a false sense of security. Managers may protect a few big accounts while churn among regular shoppers goes unchecked, leaving a fragile revenue base. When a high‑spender leaves, the impact is immediate and noticeable; when a cohort of repeaters drifts away, the loss is gradual and often goes unnoticed until the cash flow gap widens.
To capture hidden loyalty, treat each transaction as a data point in a larger story. Combine amount, date, and store location to map a rhythm, then design loyalty triggers that reward consistency, not size. For example, a ‘Visit, Get Off’ badge can be displayed in the app, reinforcing the shopper’s identity as a valued regular.
- Identify customers with at least two visits in the past month.
- Map intervals between visits to spot regular patterns—daily, every‑other‑day, weekly, or monthly cycles.
- Design a simple reward—such as a discount on the next visit—that activates after the identified interval. Make the reward proportional to the effort required to return, so a weekly shopper gets a modest perk, while a monthly shopper receives a slightly larger incentive.
- Communicate the reward through the preferred channel (WhatsApp, SMS, email). Personalize the message with the shopper’s name and a reference to their most‑frequent purchase category.
- Monitor repeat rate for a few weeks and adjust timing if patterns shift. If a shopper’s interval lengthens, consider a “We miss you” re‑engagement offer to shorten the gap.
Check your POS reports today for customers who appear more than once in a short span, and flag them as priority targets for a repeat‑buyer focused campaign. Remember, the goal is not just to reward the first repeat but to embed a habit that makes the next repeat feel natural.
Techniques to Uncover True Repeat Buyers from POS Records
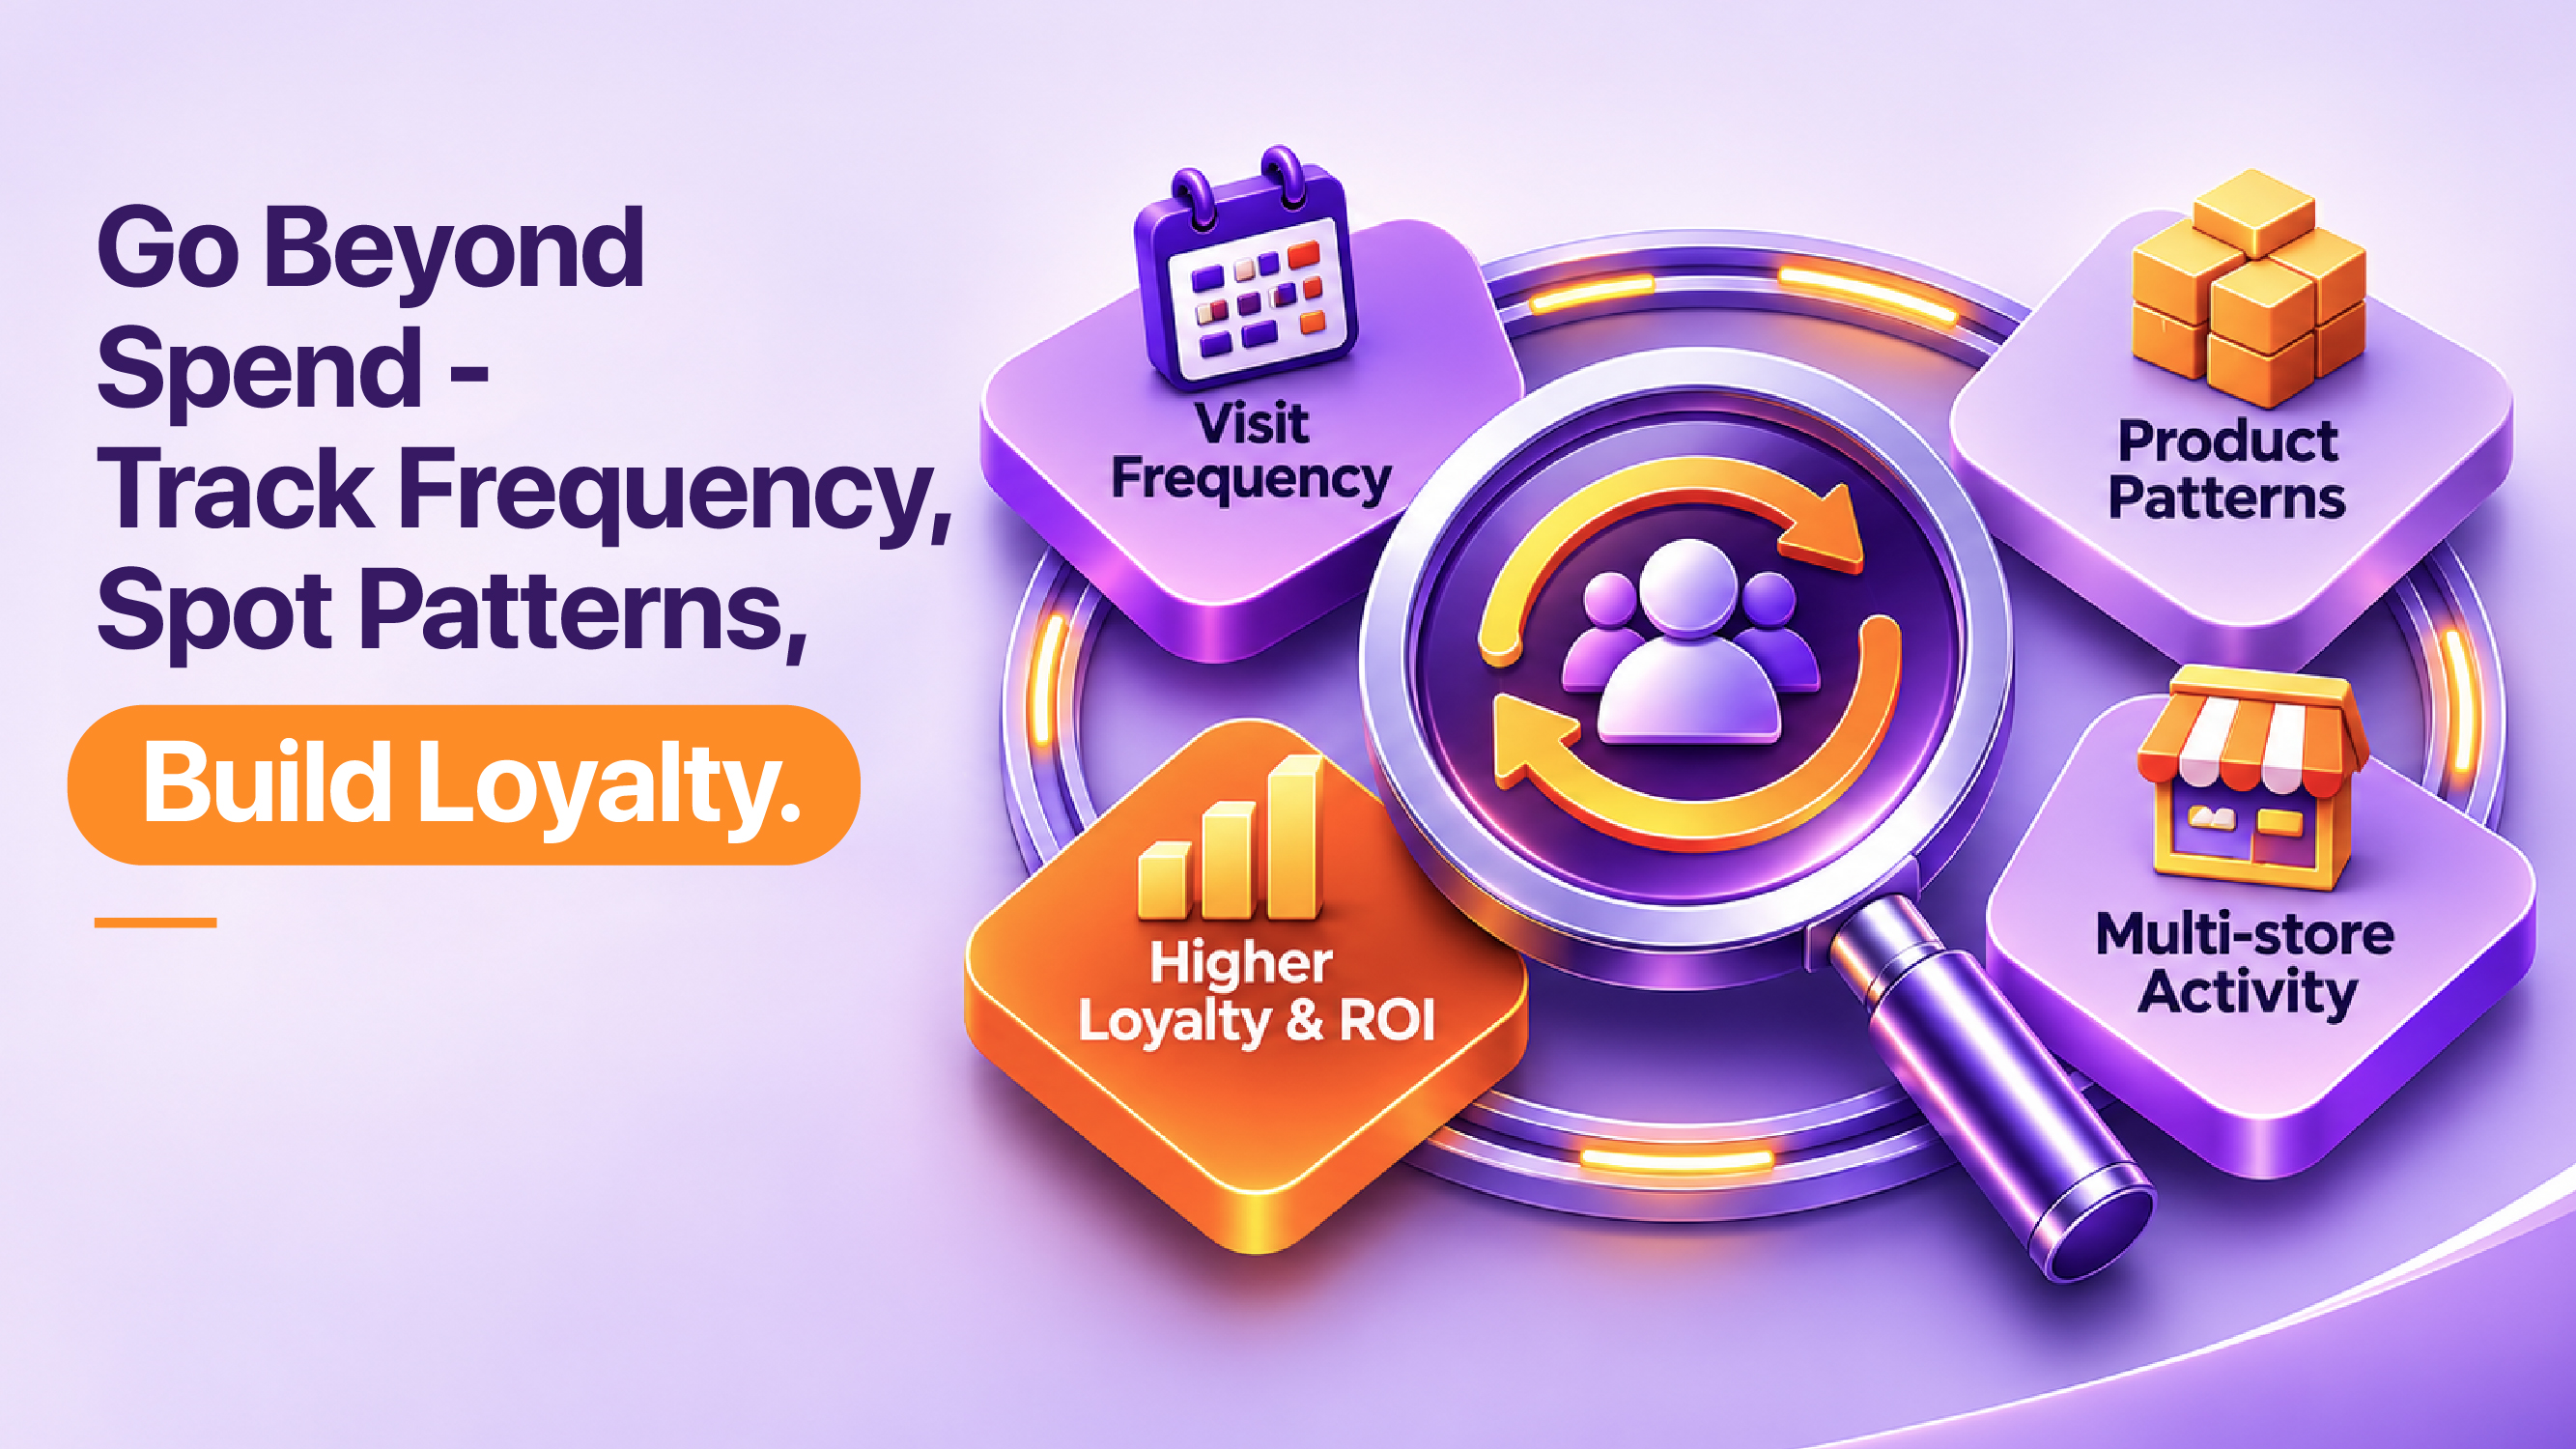
To pull true repeat buyers from raw POS logs, focus on how often the same shopper returns, what they buy each time, and whether they shop at multiple locations. Those patterns reveal loyalty that spend alone hides. The process begins with data hygiene: ensure phone numbers, email addresses, and loyalty IDs are consistently captured, then move to temporal aggregation.
Three data points that separate genuine repeaters from one‑off big spenders
1. Visit Count: The raw number of distinct days a customer appears in the system over a defined window. A shopper who appears on ten separate days in a month demonstrates a habit that a single $500 ticket cannot match.
2. Product Mix Consistency: The degree to which the items purchased belong to the same category or complementary categories. A customer who repeatedly buys fresh produce and dairy shows a grocery‑shopping routine, while a one‑off electronics purchase lacks that repeatable pattern.
3. Cross‑Store Footprint: Whether the shopper’s ID appears in multiple store locations or formats (e.g., flagship, outlet, pop‑up). A cross‑store presence signals brand‑wide affinity and offers opportunities for omni‑channel incentives.
Start by extracting the last 90 days of transactions. Clean the data to merge duplicate identifiers (e.g., a shopper who used both a phone number and an email on different visits). Then, create a “Repeat‑Buyer Table” that lists each unique shopper alongside three calculated fields: total visits, distinct product categories, and number of stores visited.
Next, apply a tiered scoring model. Assign points for each visit beyond the first, extra points for each additional product category, and bonus points for multi‑store activity. The resulting score surfaces the most valuable repeaters—those who are frequent, diverse, and brand‑wide.
Once you have the scored list, embed it into your marketing automation platform. Set up dynamic segments such as “Weekly Grocers”, “Monthly Beauty Buffs”, and “Cross‑Store Explorers”. Each segment receives a tailored communication cadence that aligns with its natural purchase rhythm.
Finally, close the loop by measuring the lift. Track metrics like repeat purchase rate, average basket size post‑intervention, and churn reduction among the targeted segments. Over successive cycles, refine the scoring thresholds to balance reach with relevance.
Implementation Blueprint – The Repeat‑Buyer Frequency Lens Framework
- Data Consolidation: Pull POS data, loyalty program data, and any ancillary channel data (e‑commerce, mobile app) into a single warehouse.
- Identifier Unification: Resolve multiple IDs to a single shopper profile using deterministic matching (phone, email) and probabilistic matching (device fingerprint).
- Visit Sequencing: Sort each shopper’s transactions chronologically and flag the date of each distinct visit (a visit is defined as any set of transactions separated by more than 30 minutes).
- Frequency Scoring: Calculate visits per week, then assign a frequency tier (Daily, Several Times a Week, Weekly, Bi‑Weekly, Monthly).
- Pattern Enrichment: Overlay product‑category vectors to see if the shopper’s basket composition stays stable or evolves, indicating opportunity for cross‑sell.
- Channel Fusion: Tag each visit with the channel (in‑store, click‑and‑collect, delivery) to understand omni‑channel loyalty.
- Actionable Segments: Combine frequency tier, category stability, and channel mix into micro‑segments such as “Weekly Fresh‑Food Shoppers – In‑Store” or “Bi‑Weekly Beauty Enthusiasts – Online”.
- Trigger Design: For each segment, define a trigger, such as after a few weekly visits, send a discount coupon for the next basket.”). Align the reward type with the shopper’s typical spend to keep margin impact controlled.
- Delivery Optimization: Use the shopper’s preferred communication channel (derived from past opt‑ins) to deliver the trigger, ensuring higher open and redemption rates.
- Feedback Loop: Capture redemption data and subsequent visit behavior; feed it back into the scoring model to continuously improve segment definitions.
By following this framework, you turn the vague notion that “your POS data hides the real repeat‑buyer” into a concrete, repeatable process that surfaces hidden loyalty, fuels personalized marketing, and ultimately steadies revenue streams.
Frequently Asked Questions
1. How can I identify true repeat buyers from POS data?
By tracking individual transaction IDs tied to loyalty or membership numbers, you can map each customer’s purchase timeline. Look for consistent visit intervals and a pattern of purchasing similar product categories, which signals a genuine repeat‑buyer rather than a one‑time high‑spend visitor.
2. What are the limitations of high spend tags in retail analytics?
High spend tags capture only the monetary value of a transaction, ignoring the frequency and loyalty of the shopper. A single expensive purchase may inflate metrics, but it does not reveal whether the customer will return, leading to misaligned marketing spend.
3. How to use POS data to improve repeat purchase rates?
Segment customers by purchase frequency and target those with a single transaction but high spend with personalized follow‑up offers. Integrating POS data with email or mobile push campaigns that reward repeat visits can reinforce buying habits.
4. High spend vs repeat buyer: which drives better ROI?
Repeat buyers generate steady, predictable revenue and are more likely to respond to loyalty incentives, creating a compounding effect over time. High spend customers may bring immediate cash flow but often require more effort to convert into ongoing relationships.
5. What ROI can be expected by focusing on repeat buyers?
Shifting focus to repeat buyers typically leads to higher customer lifetime value, as these shoppers engage more consistently with promotions and brand touchpoints. The resulting stability in sales often outweighs the volatility of occasional high‑spend spikes.
Your POS may spotlight the biggest ticket, but it obscures the steady rhythm of everyday shoppers who keep your business alive. By shifting focus from single high‑spend events to the frequency of visits, you uncover the true drivers of profitability and loyalty. Recognizing this hidden pattern turns routine transactions into a clear narrative of repeat engagement.