
Not every lost customer shouts; most slip away quietly, lightening your balance sheet before you notice. Retailers fear unseen departures that erode revenue. POS churn detection reads quiet signs in transaction habits so you can act before loss becomes obvious.
Understanding POS Churn: Key Concepts and Why It Matters
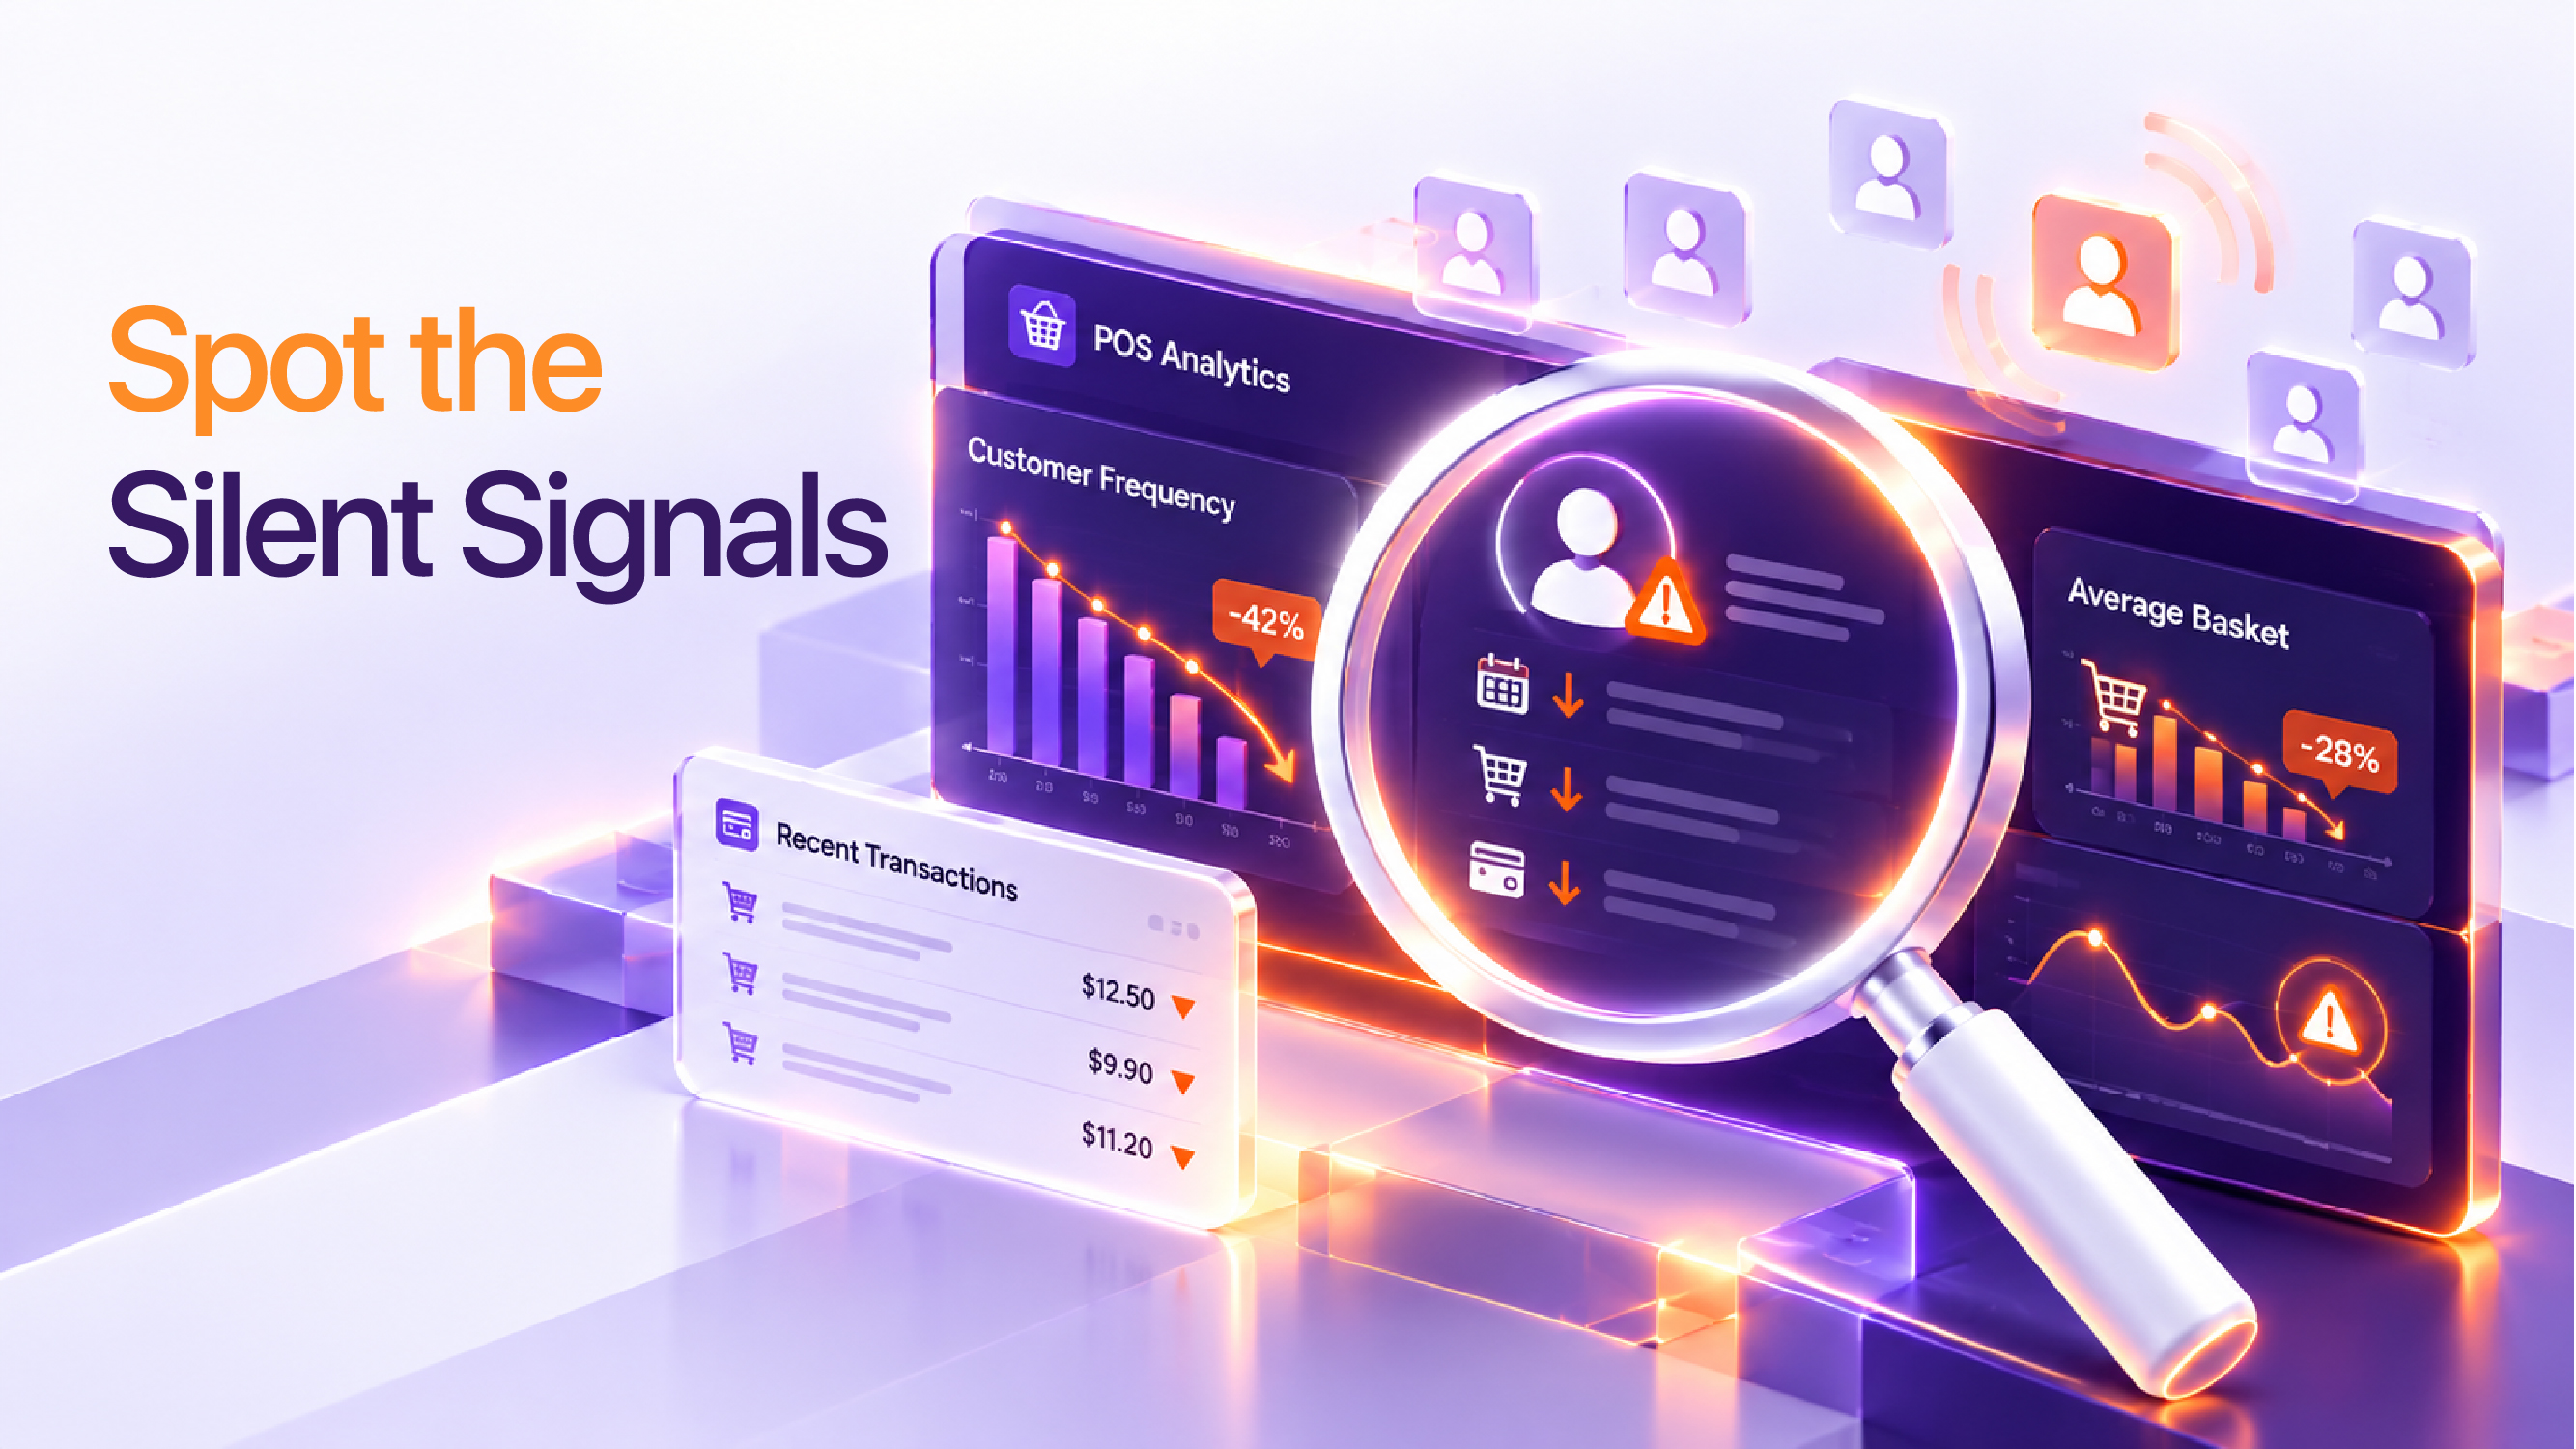
Churn hides when a regular shopper’s visits thin out and spend shrinks, long before any complaint. Those subtle slips are early alarms that a customer is drifting away. Spotting them early lets you intervene while there’s still a chance to win them back.
- What the pattern looks like on the shop floor
Imagine a loyal family that used to pop in every weekend for sweets. Over weeks they come only once and buy fewer items. Without a tracking system, the shift blends into normal traffic.
In a fashion outlet, a regular buyer who once bought a new outfit each month now appears only for big sales, dropping from several pieces to a single accessory. The loss feels small daily but adds up across many shoppers.
For a supermarket expanding into tier‑2 cities, a neighborhood shopper who filled a cart every Friday now buys just a few staples. The POS logs the transaction, but the manager sees only a dip in footfall, not the churn signal.
These examples illustrate the core of POS churn detection: watching purchase rhythm, not just total sales. When the rhythm slows, the relationship weakens.
Retail churn analysis focuses on three tell‑tale signs that appear before a customer disappears:
- Frequency drop: the gap between visits stretches beyond the usual pattern.
- Basket shrink: the value or number of items per visit falls noticeably.
- Category drift: the shopper shifts away from high‑margin categories to basics.
Each sign alone might be normal, but together they form a red flag. A shopper who buys less often, spends less, and stops buying premium items is likely on the brink of leaving.
Why does this matter? When spend drops, the impact looks modest, but the cumulative effect across many shoppers erodes revenue quietly. By the time churn is obvious, the loss is already baked into the month’s numbers.
F&B churn follows the same logic. A regular who used to order a full meal now orders only a beverage. The POS records a smaller ticket, signaling early churn.
Detecting these patterns requires pulling transaction data into a view that tracks each shopper’s history, not just daily totals. The system should flag deviations in cadence or basket size-this is the essence of POS churn detection.
Once flagged, reach out with a personalized offer-a discount on a favorite category, a loyalty reminder, or an invitation to a special event, to re‑engage before the habit fully breaks.
In practice, set up a dashboard that shows the last few visits for each customer, highlights gaps longer than usual, and notes a dip in spend. Review it weekly and prioritize shoppers with the biggest changes.
Action step: Pull the last three months of transaction data, identify customers whose visit frequency or basket size has slipped, and add them to a re‑engagement list for targeted outreach.
Step-by-Step Guide to Detecting Hidden Churn in Your POS Data

Treat your sales register like a detective’s notebook, looking for patterns that show a regular shopper has stopped coming. Export the raw transaction list, then compare each customer’s buying rhythm, product mix, and gaps against expectations. When the rhythm breaks, you have a clue that a loyal buyer is slipping away.
- Audit the transaction log
Export every sale from the past few months into a spreadsheet. Include all payment types; this raw dump shows who bought what and when.
Sort the data by customer identifier – phone, loyalty card or email. Look for identifiers that appear repeatedly and then disappear. A sudden stop after a steady stream signals hidden churn.
Flag any customer whose last purchase predates the most recent promotional cycle.
Measure the time‑to‑purchase interval. Calculate the typical gap between visits for each shopper. When the gap stretches beyond that norm, it signals disengagement.
Examine cross‑product ratios. Loyal customers often buy core item pairs (e.g., a bakery item with coffee). Identify customers whose recent baskets miss these pairings; a tea lover buying only biscuits, for example, shows a subtle shift.
- Export the complete transaction history for the last quarter.
- Group sales by customer identifier and highlight any that have vanished after a steady run.
- Calculate each shopper’s average visit gap and flag those whose current gap has widened noticeably.
- Map typical product pairings for each shopper and spot recent purchases that break those patterns.
- Compile a short list of flagged shoppers and send it to your loyalty or outreach team for a personal check‑in.
Run this audit after every major sales event – Diwali, end‑of‑season clearance, or a new store opening. Making the review routine turns hidden churn into a regular alert rather than a surprise.
The goal isn’t to chase every missed purchase but to catch early warnings before the customer disappears. A quick call, personalized WhatsApp note, or small surprise offer can often pull them back.
Check your POS system for a built‑in export feature and integrate it with a simple analytics layer that we call the Transaction Pulse Model. This framework treats each shopper’s transaction stream as a pulse: a series of beats (visits) with amplitude (basket size) and frequency (time between beats). By establishing a baseline pulse for each segment-based on the last 8‑12 transactions-you can automatically detect deviations that exceed a pre‑defined tolerance. The model works in three layers:
- Baseline Calibration: For every identified customer, the system records the average inter‑visit interval, average ticket value, and typical product‑category mix over a rolling window. This creates a personalized “heartbeat” for the shopper.
- Deviation Detection: When a new transaction arrives, the model compares the actual interval and ticket size to the baseline. If the interval is 1.5 times longer than normal or the ticket value drops below a set fraction of the baseline, a churn risk flag is raised.
- Action Trigger: The flag feeds directly into your CRM or marketing automation platform, queuing a targeted outreach—such as a “We miss you” coupon, a reminder of earned loyalty points, or an invitation to an exclusive preview.
Implementing the Transaction Pulse Model does not require sophisticated machine‑learning infrastructure. A spreadsheet with simple formulas or a lightweight BI tool can calculate the averages and thresholds, while a rule‑engine (many POS platforms include one) can generate the alerts. The key is consistency: run the pulse calculation nightly, update baselines weekly, and ensure the outreach team has a clear playbook for each alert tier.
By embedding this model into your regular audit, you move from a reactive “someone vanished” mindset to a proactive “we saw the pulse slow, now we intervene” approach. Over time, you’ll notice a higher retention rate, because you’re catching the whisper of churn before it becomes a shout.
Frequently Asked Questions
1. How can a retail executive identify hidden churn in POS data?
A retail executive can start by examining transaction frequency trends for each customer segment, looking for sudden drops in purchase cadence that may indicate disengagement. Cross-referencing loyalty program activity with POS scans can also reveal customers who stop redeeming points despite frequent store visits, a subtle sign of hidden churn.
2. What specific metrics should be tracked to detect churn in a POS system?
Key metrics include repeat purchase rate, average basket size per visit, time between visits, and the ratio of in‑store to online transactions. Monitoring the number of abandoned cart scans and the frequency of returns per customer can further highlight those at risk of leaving.
3. How do you set up a step-by-step process to analyze POS churn?
First, aggregate POS data by customer ID and segment, then calculate baseline engagement metrics. Next, apply a sliding window to detect deviations from these baselines, flagging customers whose behavior falls below predefined thresholds. Finally, visualize the flagged cohort in a dashboard and trigger targeted re‑engagement campaigns.
4. What are the differences between POS churn detection and traditional churn analysis?
POS churn detection focuses on in‑store transaction patterns and real‑time scan data, capturing micro‑shifts in shopping habits that traditional models—often based on subscription or service usage—might miss. It also leverages point‑of‑sale touchpoints to assess immediate purchase intent rather than relying solely on long‑term customer lifecycle data.
5. What ROI can be expected from implementing POS churn detection in 2026?
Implementing POS churn detection enables retailers to proactively re‑engage at‑risk customers, reducing the need for costly acquisition campaigns and preserving long‑term brand loyalty. The resulting improvement in customer retention and average spend per visit translates into a sustainable lift in overall profitability.
By watching the rhythm of each transaction, retailers can hear the quiet footsteps of customers drifting away before the loss becomes obvious. Recognizing those subtle changes in purchase patterns lets a business pause and respond while the relationship is still salvageable. In the end, staying attuned to POS churn is a quiet but powerful way to keep loyal shoppers on the floor.