In the world of CRM and customer analytics, businesses often focus on counting customers and tracking revenue. But what if these metrics don’t fully capture the true health of your customer relationships? That’s where the Engagement Health Index (EHI) comes in, offering a more in-depth look at your active customer base and providing predictive insights that can shape your marketing and retention strategies.
The Problem with Traditional Metrics: Why Customer Counts Aren’t Enough
Traditional metrics, like customer counts, can be misleading. Consider two businesses, each with 10,000 active customers. On the surface, they look identical, but a closer look reveals a stark contrast:
- Business A: 8,000 Engaged | 1,500 Disengaged | 500 Drop-Off → EHI: 87
- Business B: 4,000 Engaged | 3,000 Disengaged | 3,000 Drop-Off → EHI: 58
Business A has a loyal, repeat customer base, while Business B is on the brink of a retention crisis. Traditional metrics would tell you that both businesses are the same size, but EHI exposes the deeper story. It’s not just about how many customers you have, but how healthy those relationships are.
What is the Engagement Health Index (EHI)?
The EHI is a predictive score ranging from 0 to 100, designed to measure the overall health of your customer relationships. It answers a crucial question:
“Are my active customers becoming more loyal, or are they quietly disengaging?”
Unlike traditional metrics that are retrospective, EHI is forward-looking, it detects shifts in engagement levels up to 60 days before they impact your revenue. This makes it a vital tool for businesses aiming to optimize customer retention and loyalty.
Read More: Segment Builder of the Week: Current Points
The Formula Behind the EHI
The EHI formula is a simple yet powerful calculation that considers three key engagement segments: Engaged, Disengaged, and Drop-Off customers.
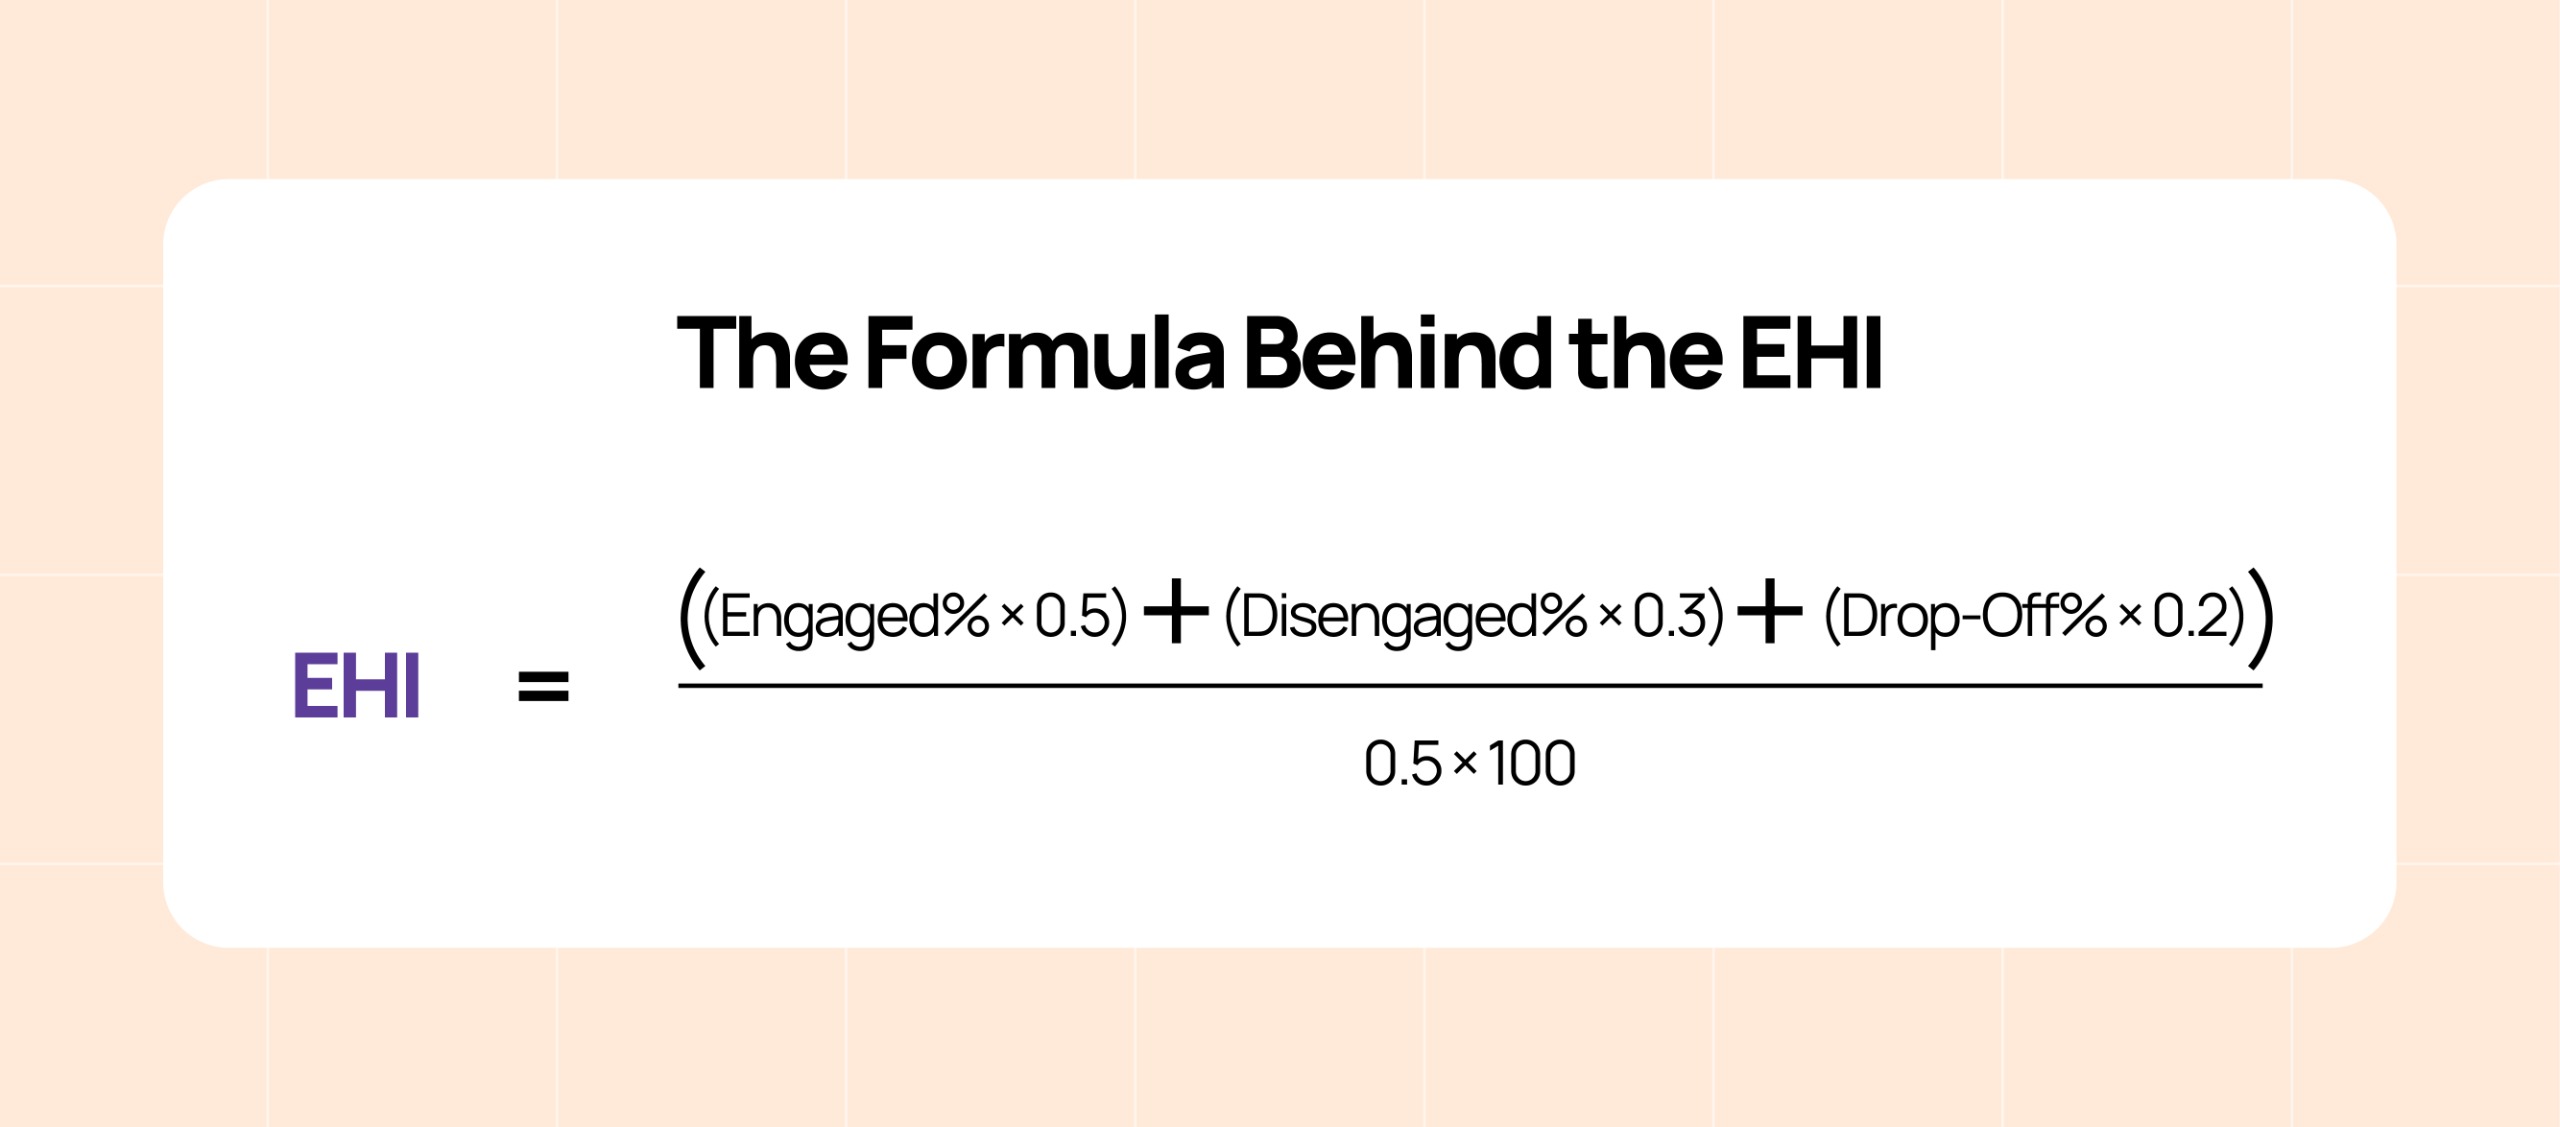
Here’s why the weights matter:
- Engaged (50% weight): Your loyal core, driving predictable revenue.
- Disengaged (30% weight): A segment with both opportunity and risk.
- Drop-Off (20% weight): An early warning signal for potential churn.
For example, let’s look at a real-world scenario:
Brand X Example:
Note: This case study is hypothetical and is used solely to illustrate how EHI can predict potential issues before they happen.
- Engaged: 37.5% of active customers
- Disengaged: 42.5% of active customers
- Drop-Off: 20% of active customers
Using the formula, Brand X’s EHI comes out to 71.0, indicating a stable but concerning trend. While not an immediate crisis, this signals that action may be needed to improve engagement.
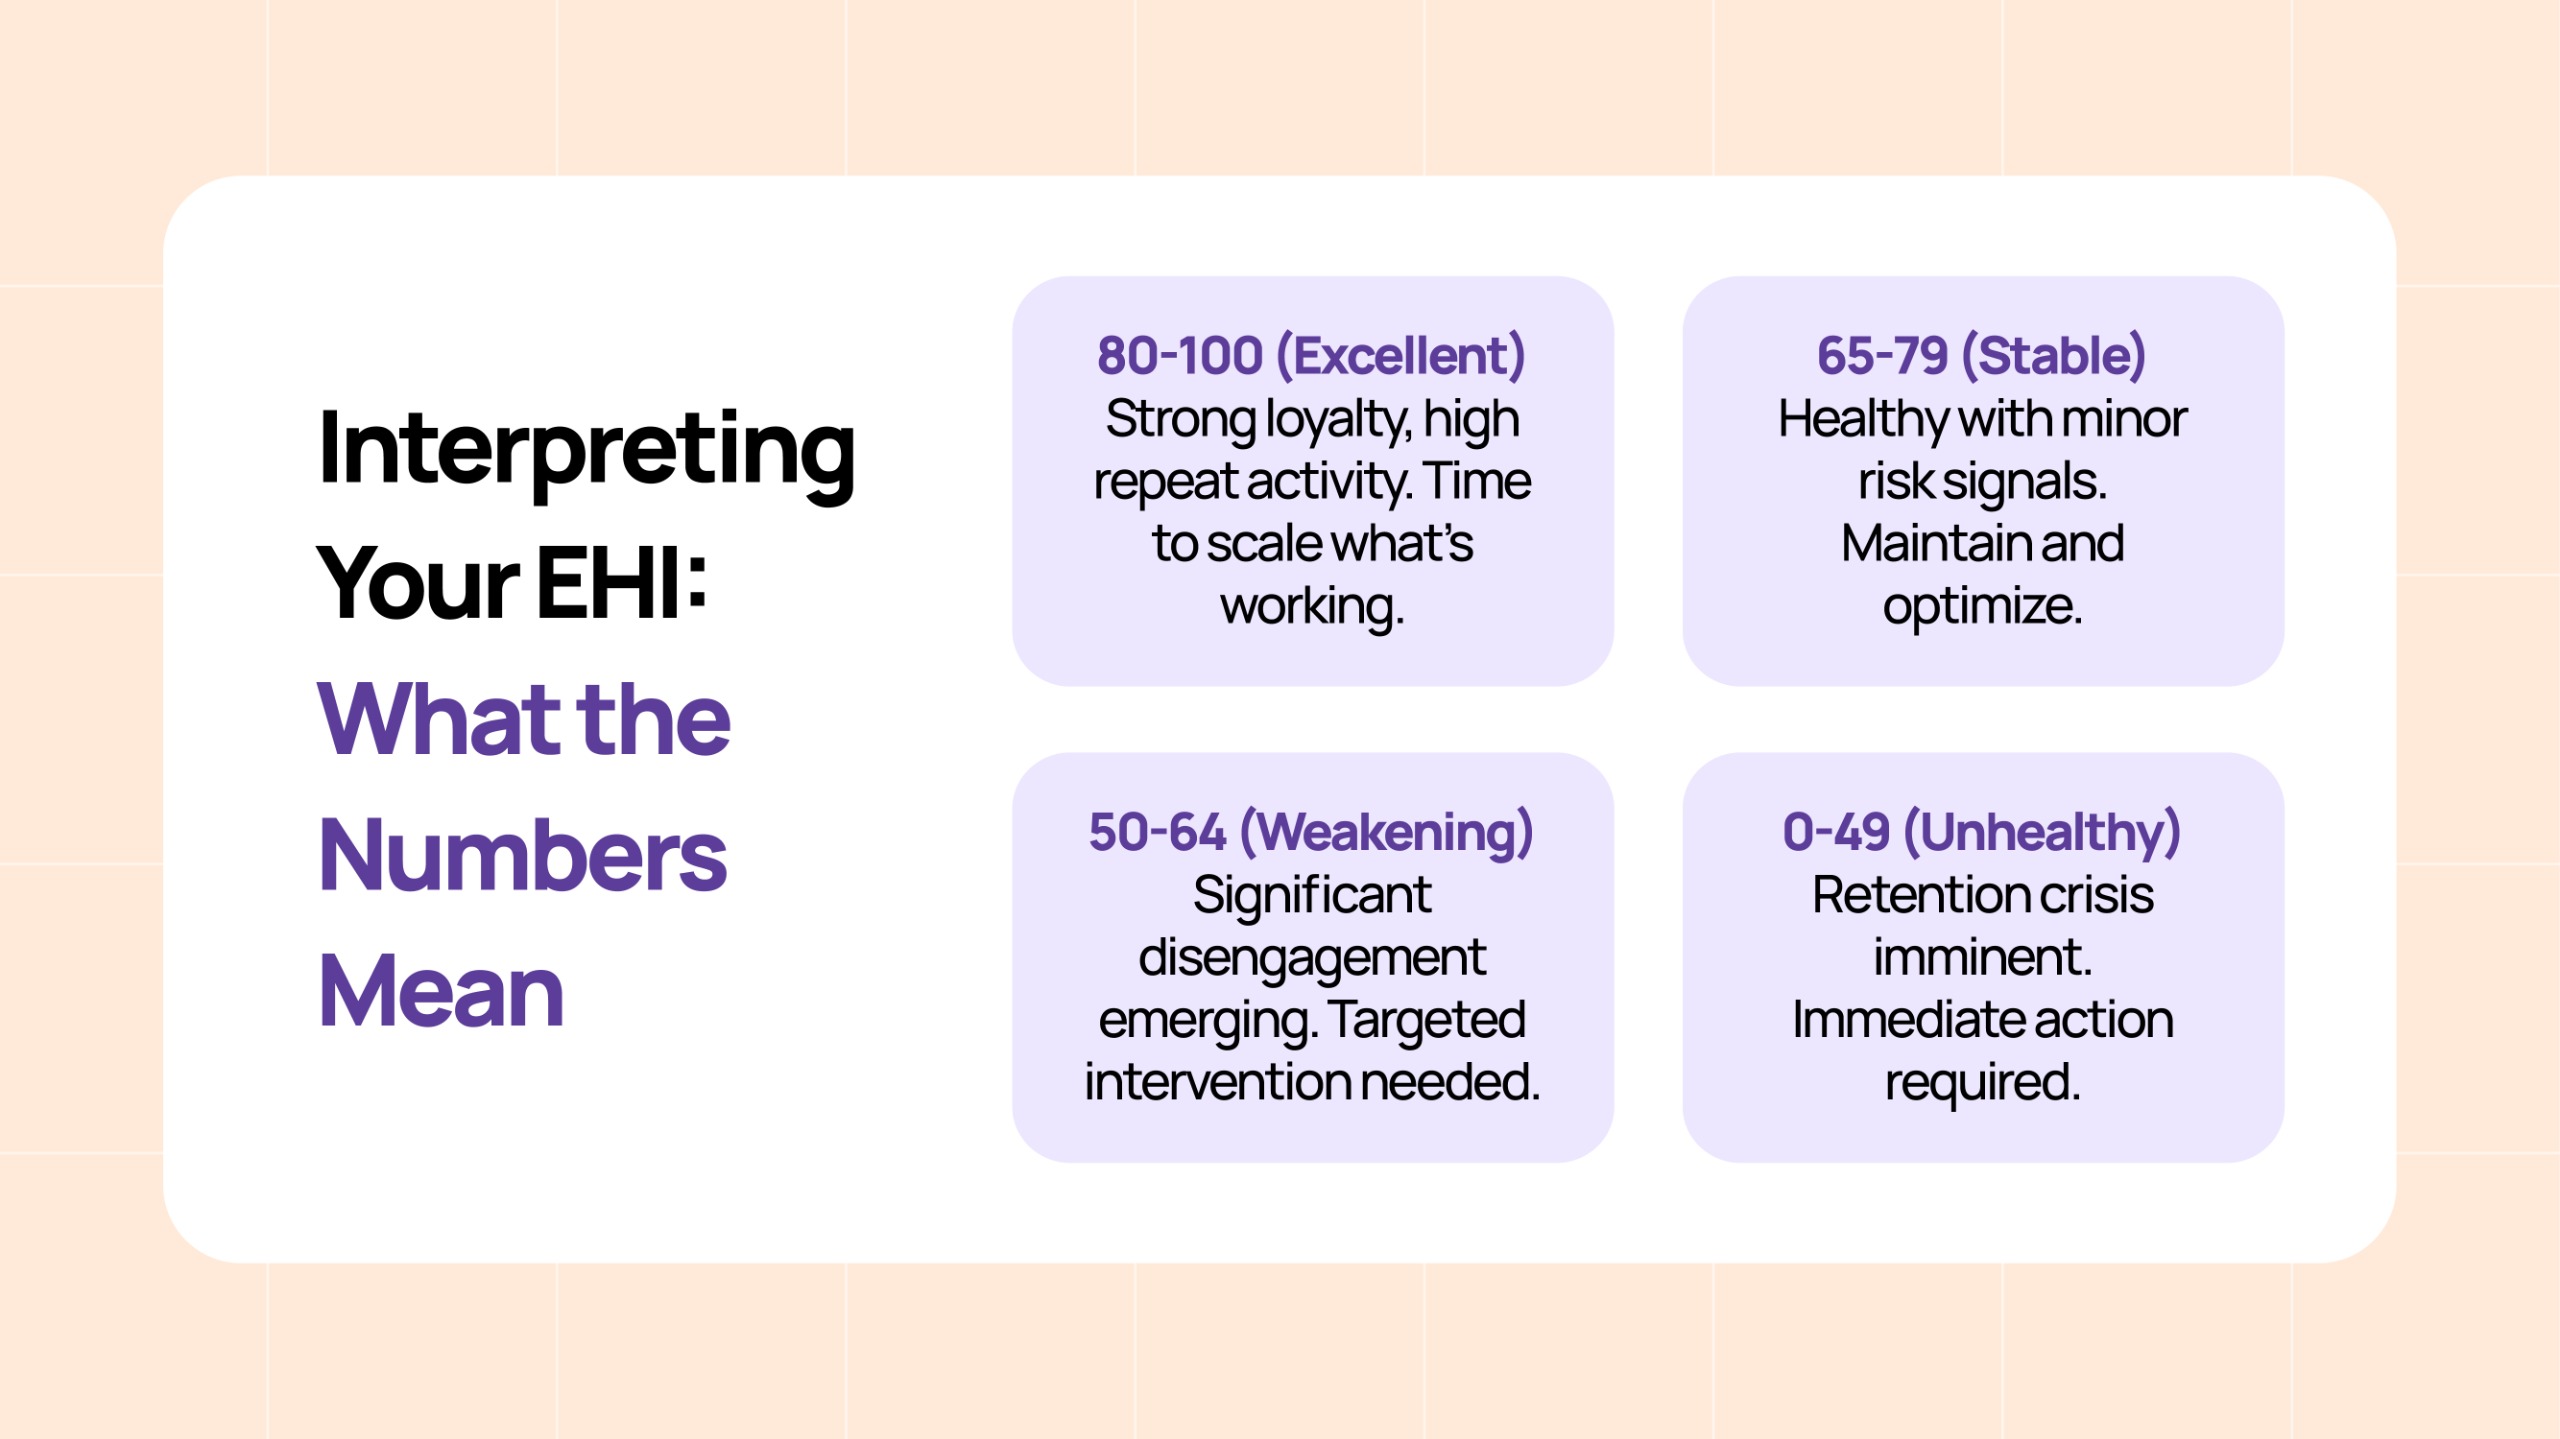
Interpreting Your EHI: What the Numbers Mean
EHI scores fall into the following health zones, offering clear guidance on how your business is performing:
Tracking EHI: Month-to-Month Insights
The true power of the EHI comes from tracking its month-over-month changes. A +5 improvement can precede a 10-15% revenue lift in the following quarter, while a decline of 5 or more serves as an early warning of loyalty erosion.
Example: BrandX
- January: EHI = 74 (Stable health)
- February: EHI = 69 (5-point drop)
- March: EHI = 65 (Further decline)
This drop in EHI predicted a revenue dip for March. Armed with this insight, the brand launched re-engagement campaigns, which stabilized revenue in April.
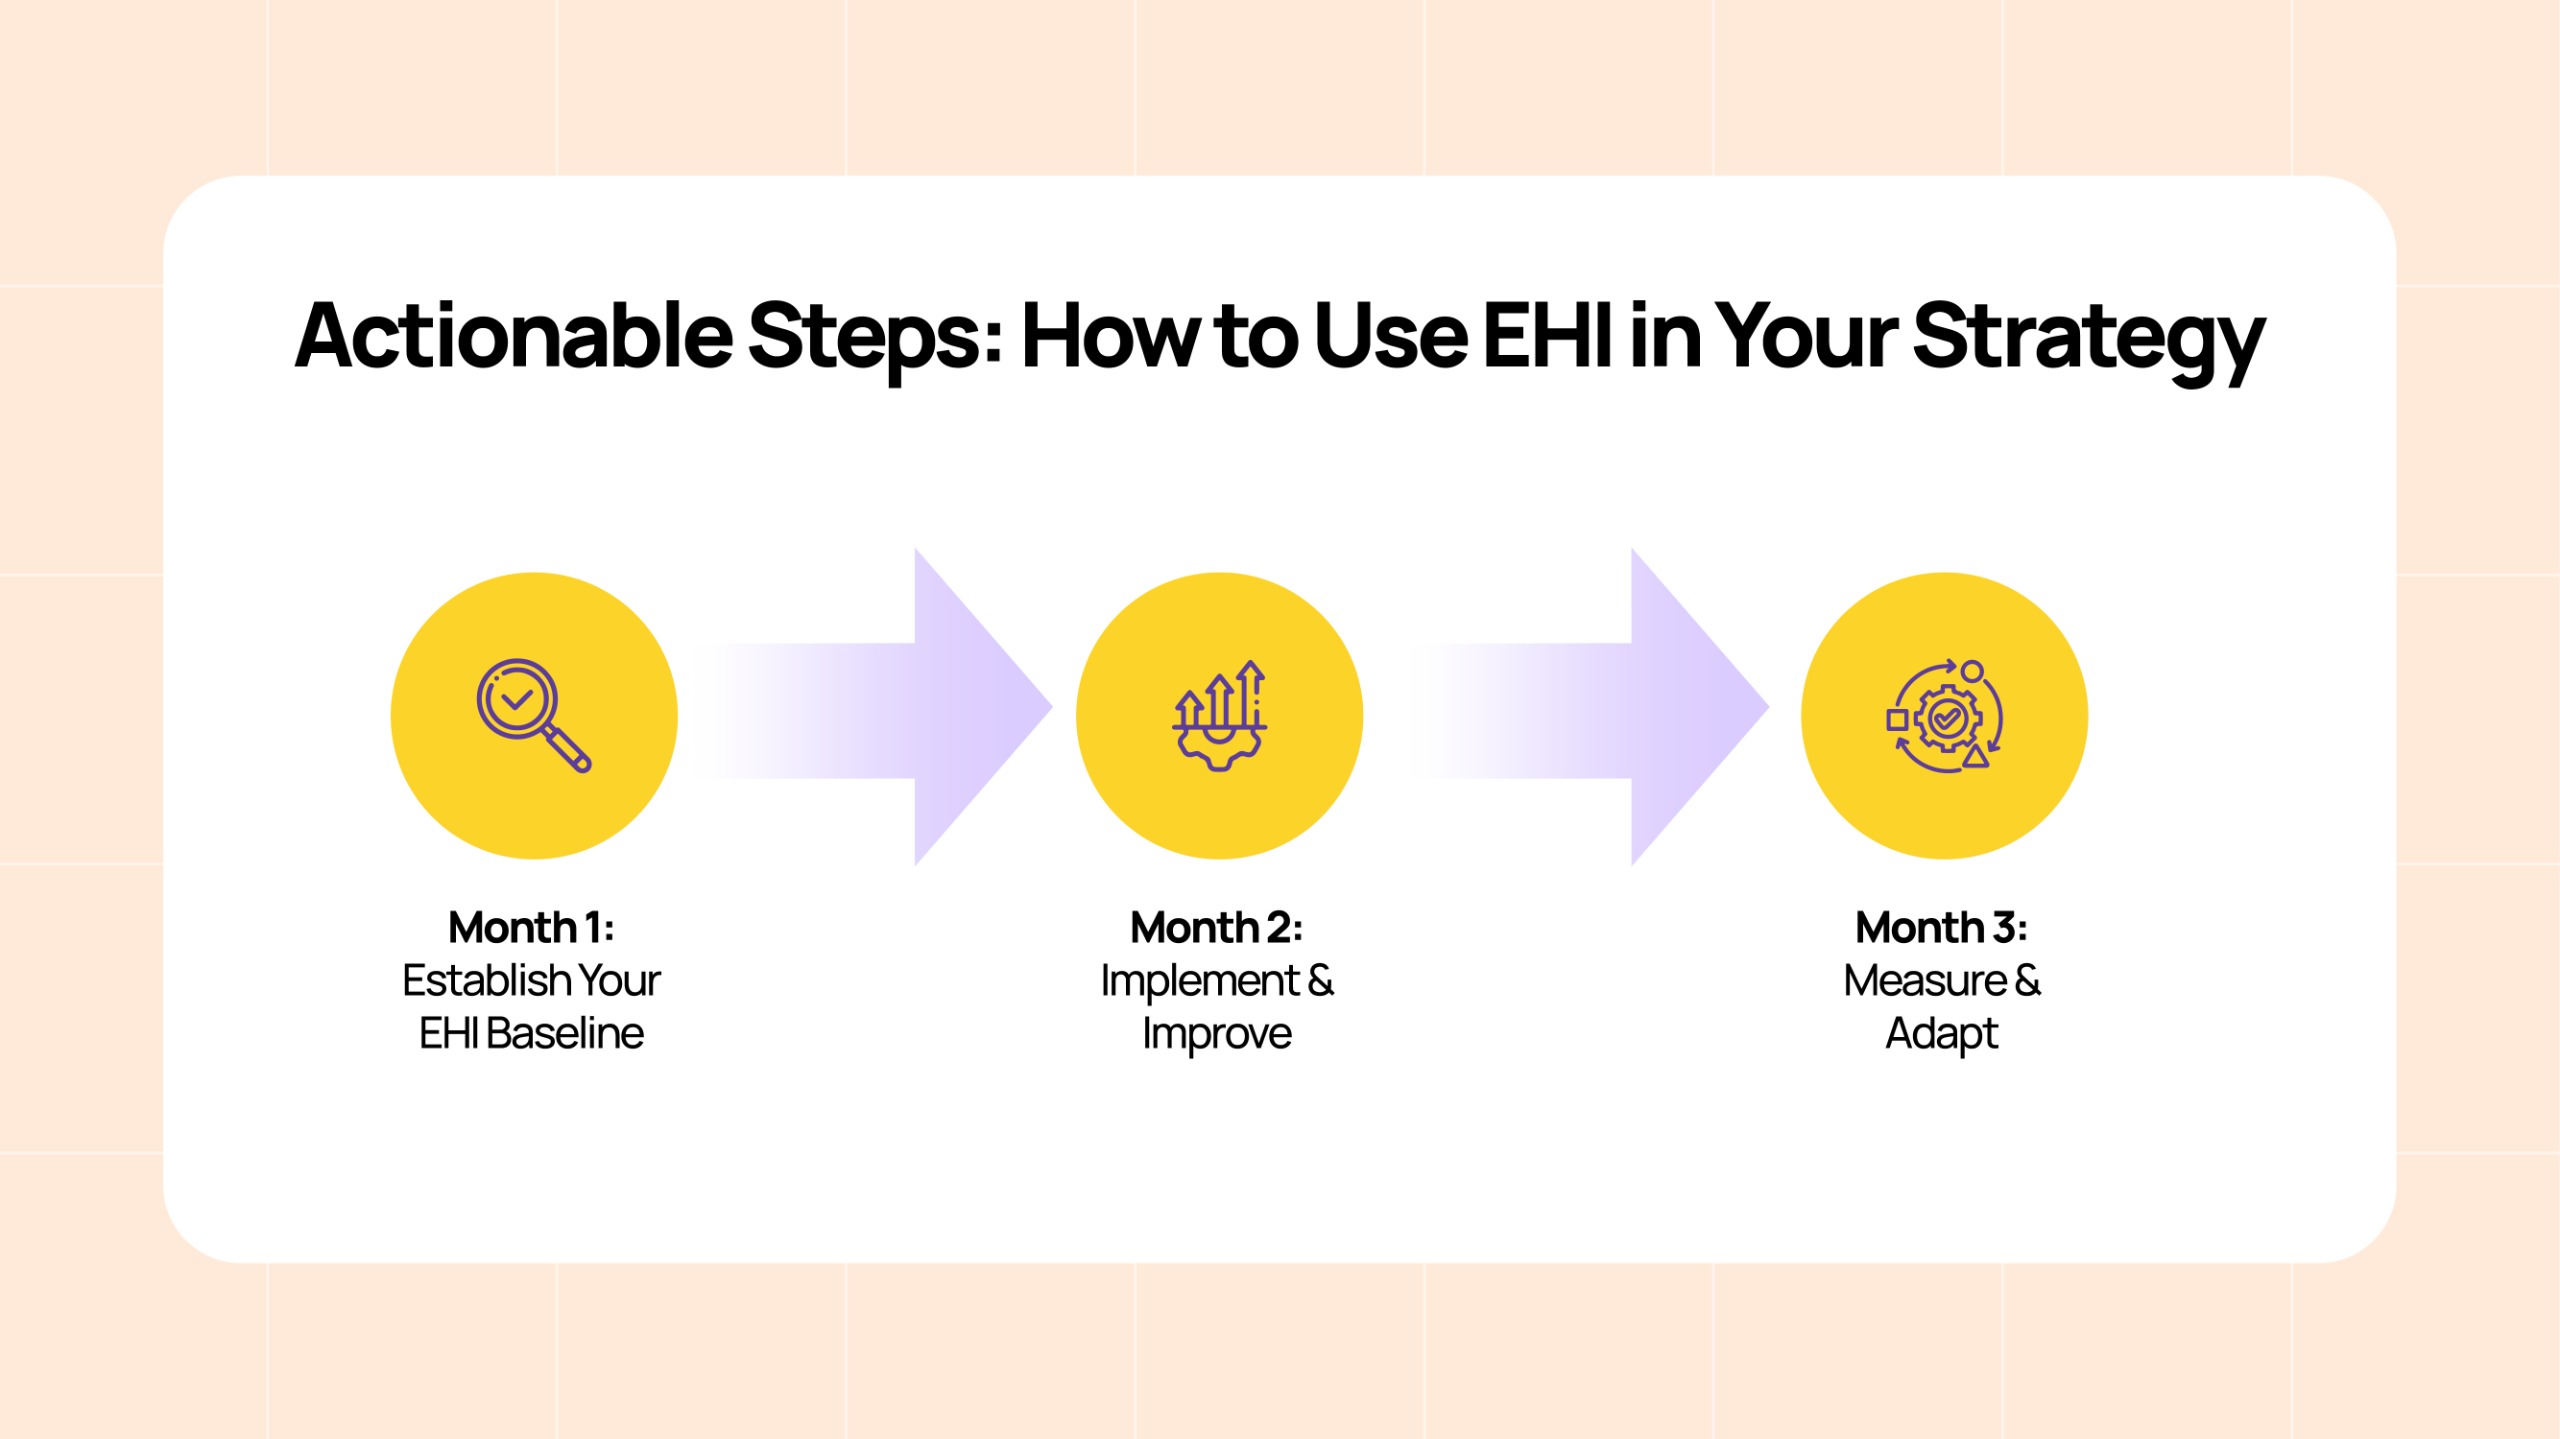
Actionable Steps: How to Use EHI in Your Strategy
Once you have your baseline EHI, here’s a 3-step cycle for improving your customer engagement health:
- Month 1: Establish Your EHI Baseline
Calculate your starting EHI and identify your health zone.
- Month 2: Implement & Improve
Focus on your weakest segment (e.g., Drop-Off customers) and run targeted retention campaigns.
- Month 3: Measure & Adapt
Review your new EHI and track improvements. Use insights from InsightX to optimize your next round of campaigns.
Why EHI is Different from Traditional Metrics
EHI stands apart from other customer metrics like Customer Satisfaction (CSAT) or Customer Lifetime Value (LTV):
- CSAT: Measures how customers feel but doesn’t predict future behavior.
- LTV: Looks at historical value but doesn’t predict future engagement health.
Retention Rate: Just measures whether customers are still there, while EHI tells you how engaged they are.
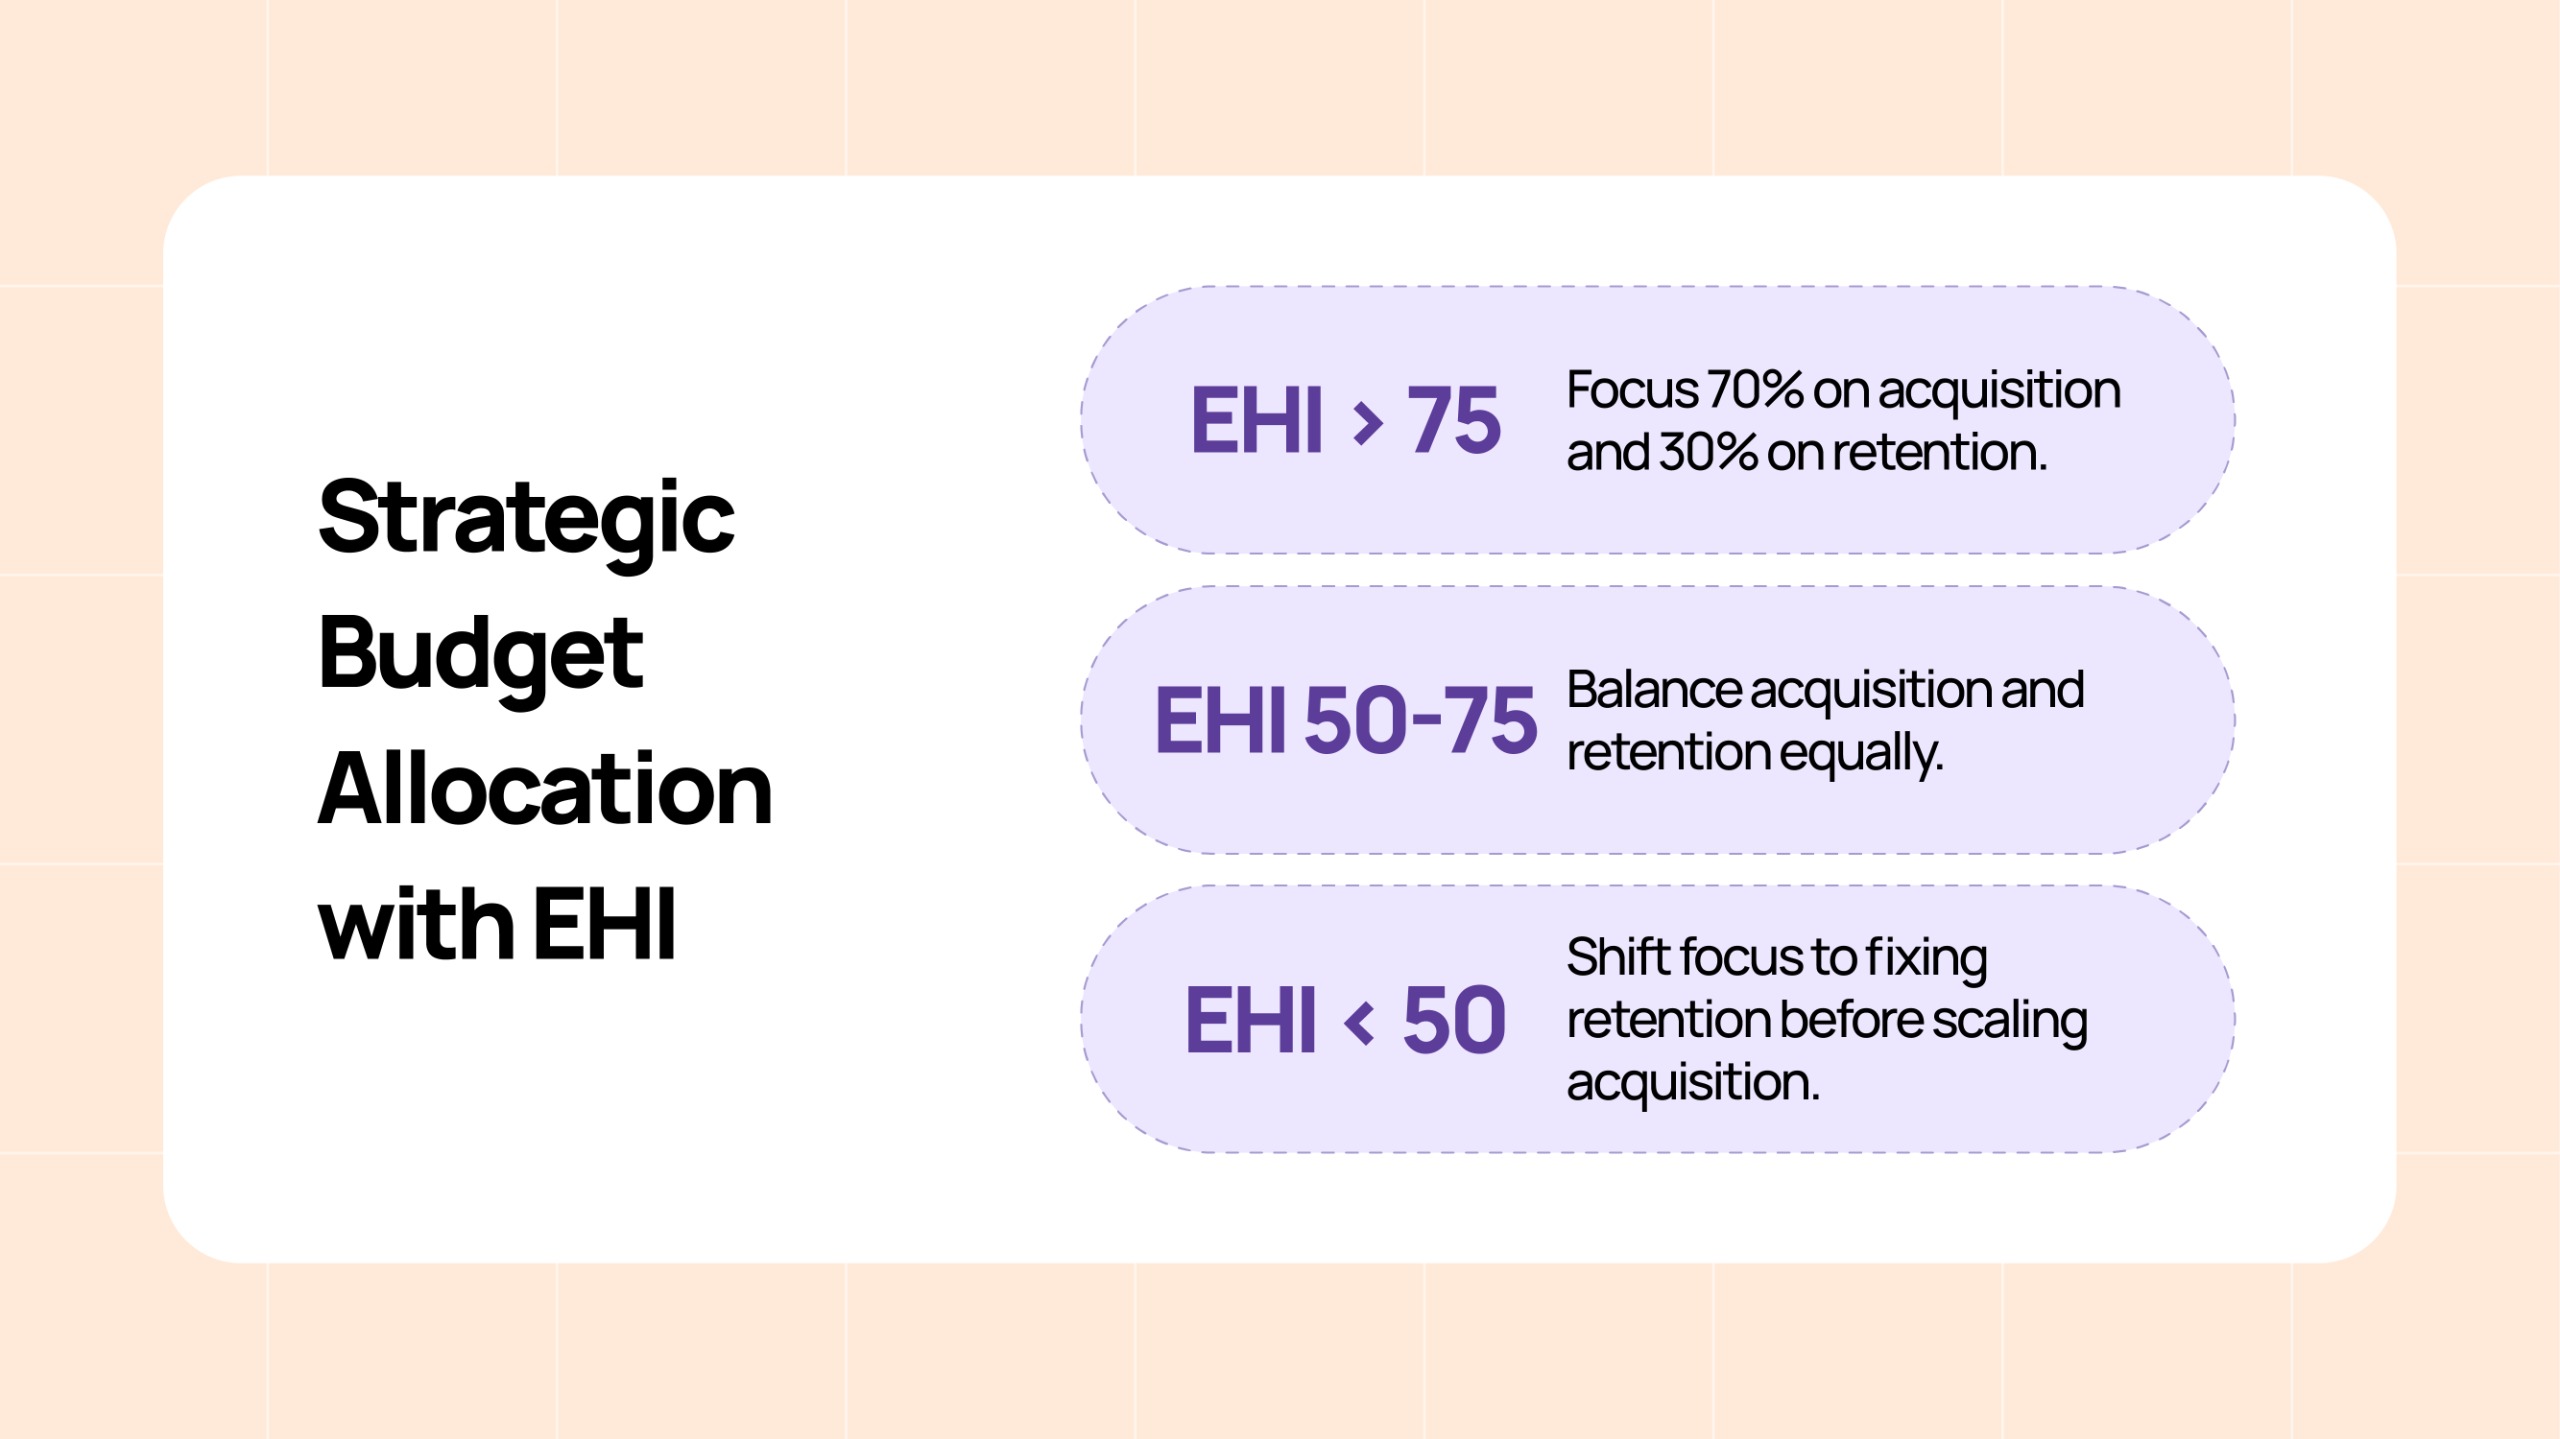
Strategic Budget Allocation with EHI
Understanding your EHI score helps you decide where to allocate your marketing budget. For example:
Future of Engagement Health with eWards’ InsightX
As eWards’ InsightX evolves, EHI will become even more powerful, driving predictive insights and automated campaign recommendations. This shift from reactive reporting to proactive strategy is transforming the way businesses approach customer engagement.
By tracking and optimizing your Engagement Health Index, you’re not just counting customers, you’re actively shaping the future of your customer relationships, one data-driven decision at a time.
Final Thoughts
This month, take a step beyond counting customers. Calculate your EHI, identify the segment that drives your score, and target that segment with tailored campaigns. By focusing on your Engagement Health Index, you can move from reactive reporting to proactive, predictive strategy, ultimately driving stronger, more loyal customer relationships.