For many retail enterprises, “customer health” is a nebulous term often buried under the weight of raw billing data and monthly revenue spikes. While a sudden surge in sales might look good on a balance sheet, it can often mask a “silent churn” where a significant portion of your formerly loyal base has stopped visiting, even as new customer acquisition costs (CAC) continue to climb.
The challenge isn’t a lack of data; it’s the gap between having a list of transactions and understanding the actual health of your customer relationships. Retail leaders need more than just a list of “who” bought; they need a strategic view of “how” the entire brand is performing across the lifecycle.
Enter the eWards Customer Lifecycle Health Report. Built on our proprietary RFM Mapping, this dashboard is designed to transform fragmented POS data into a clear, actionable picture of your brand’s retention and growth potential.
Why This Matters for Retail Enterprises
In the highly competitive Indian retail landscape where festive cycles drive massive acquisition but off-seasons often see high attrition relying on revenue alone is a risk. Global retail trends also show that retaining a customer is 5 to 7x cheaper than acquiring a new one.
The Lifecycle Health Report moves beyond “who is a VIP” and answers the executive-level question: “Is our customer base getting healthier, or are we burning through our audience?” By tracking shifts in engagement zones monthly, retail teams can:
- Decide where to spend retention budget: Should you focus on “At-Risk” win-backs or “Dormant” re-engagement?
- Identify early warning signals: Spot a decline in “Active” customers before it hits next month’s revenue.
- Prepare campaign strategy: Use health trends to plan targeted promotions that move customers from one lifecycle stage to the next.
The Framework: RFM Mapping
Most CRM tools use RFM (Recency, Frequency, Monetary) to tag individual customers. eWards takes this a step further which aggregates these tags into a high-level health snapshot.
The Core Metrics We Track:
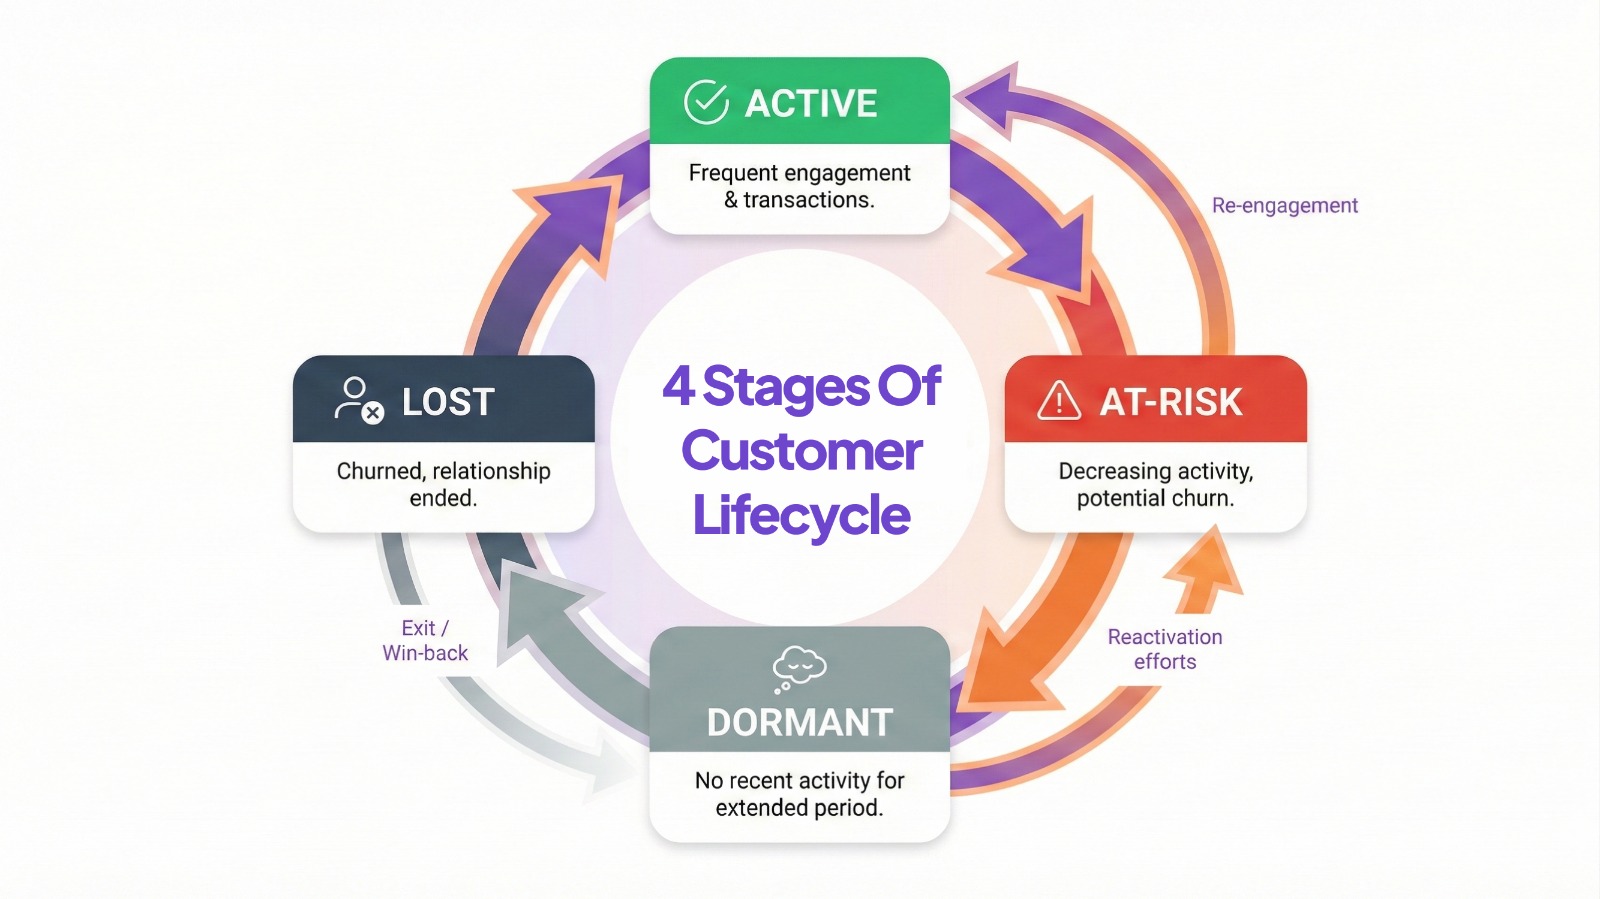
1. Lifecycle Triage: A monthly count and percentage shift of customers across four critical states: Active, At-Risk, Lost, and Dormant.
2. Engagement Zones: Beyond just “buying,” this tracks how customers interact with your brand across touchpoints.
3. The “Silent Churn” Indicator: By comparing current month health to the previous month using a standardized percentage change formula, the dashboard highlights negative trends in your loyal segments.
How it Complements Your Existing CRM:
The standard CRM report tells you who to message today (e.g., “Send a coupon to these 500 VIPs”). The Lifecycle Health Report tells you how your brand is doing overall (e.g., “Our VIP segment shrunk by 5% this month; we need to adjust our loyalty rewards”).
Metrics and Measurement Guidance
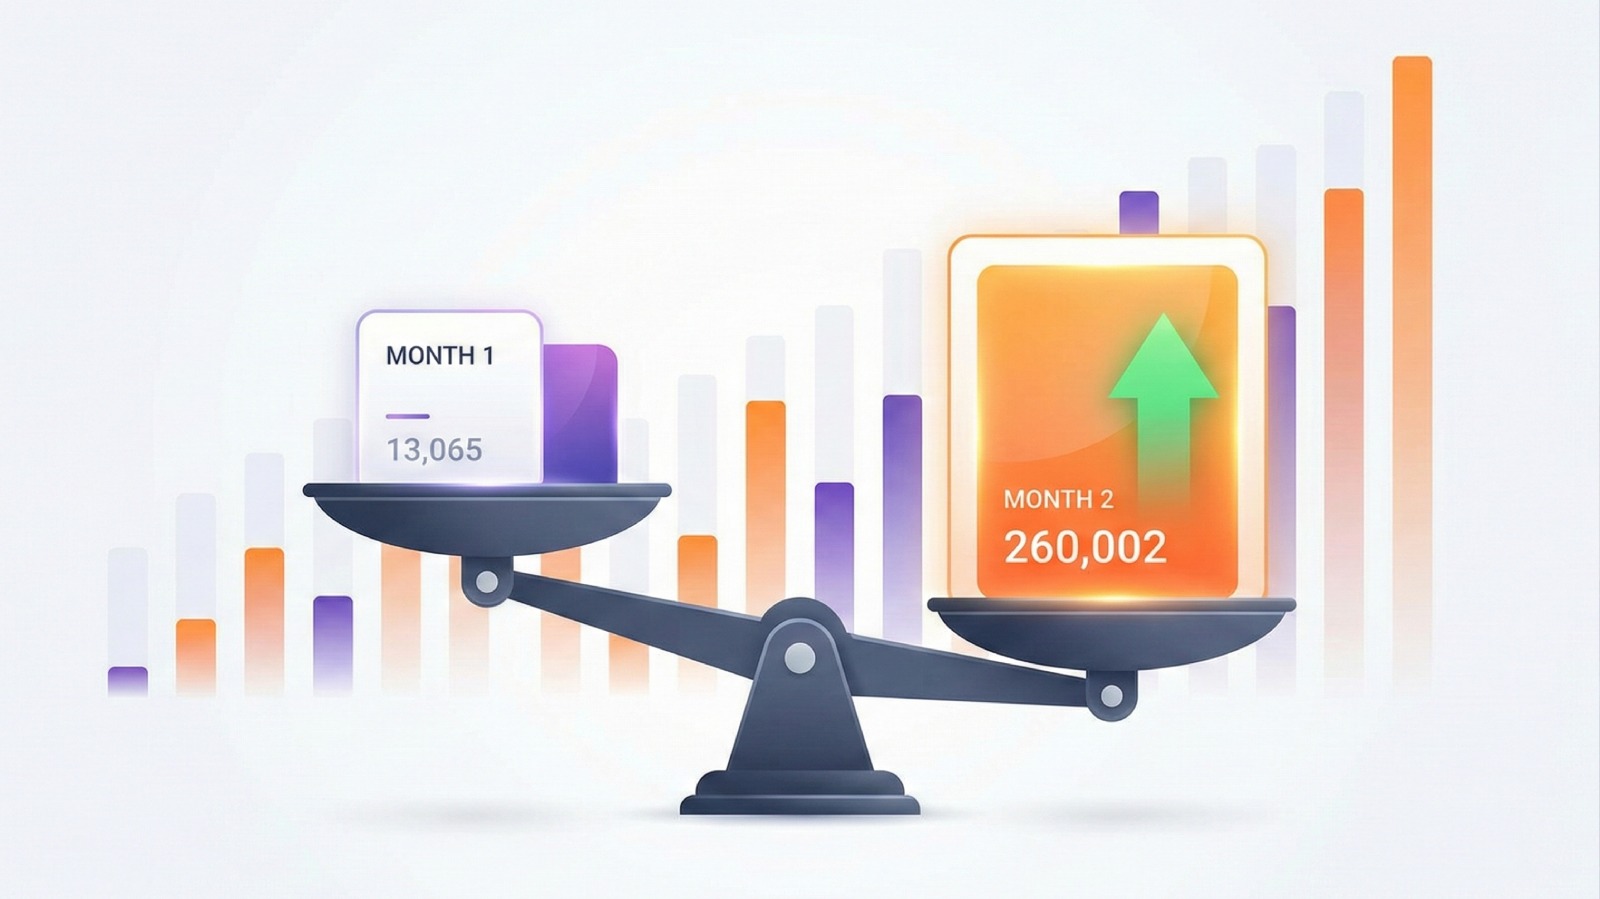
To get the most out of the Lifecycle Health Report, retail teams should focus on the Percentage Change metric. eWards calculates this consistently across all health metrics:
((Current Month Value – Previous Month Value) / Previous Month Value) * 100
A positive change in your “Active” zone combined with a decreasing “At-Risk” count is the gold standard of a healthy, growing retail brand.
Actionable Takeaway: The Monthly Health Audit
Don’t wait for quarterly reviews. At the start of every month, your CRM and Marketing teams should use the eWards Lifecycle Health Report to:
1. Verify the “Net Growth”: Did the number of new “Active” customers outpace those falling into “At-Risk”?
2. Audit the Budget: If “Lost” customers are increasing, re-allocate a portion of your acquisition budget toward a “Win-Back” campaign for the “At-Risk” segment.
3. Report to Leadership: Use the clean, visual dashboard to explain customer health trends without getting bogged down in technical data jargon.