
Beyond Loyalty Points
Loyalty points are a blunt tool that filter out customers who shop rarely yet drop large tickets, so they never surface as “top spenders.” A fashion retailer sees a surge in high‑ticket purchases during Diwali, but because those shoppers skip the points program, the CRM dashboard shows them as low‑value. The reality is that the spend is happening, just off the radar.
- Signal Fusion Layer
The first pulse of The 3‑Pulse Value Map captures raw spend across every touchpoint. It pulls transaction totals from POS registers, cart values from the e‑commerce checkout, and even social‑media referral credits. When a customer orders a premium gift set online, then later picks up a seasonal collection in a tier‑2 store, both events feed into a single spend profile.
- In‑Store Heat Mapping
The second pulse adds context by mapping in‑store behavior. Sensors at the entrance, QR scans at product displays, and cashier notes about cash‑only purchases feed into a heat map that highlights heavy spenders who avoid the loyalty card. During the post‑EOSS rush, cash‑only shoppers line up for high‑margin accessories; the map flags them for follow‑up.
- Social Sentiment Overlay
The third pulse layers sentiment from Instagram comments, WhatsApp inquiries and brand‑related hashtags. A shopper who tags a luxury handbag with a personal story often signals willingness to spend on premium lines, even if their loyalty balance is low. The overlay surfaces these intent signals for the segmentation engine.
Action: Deploy a data pipeline that aggregates POS, e‑commerce, and social signals into a unified spend ledger before the next festive season.
Dynamic Segmentation Engine: A real‑time segmentation model adapts to changing purchase behaviors across channels
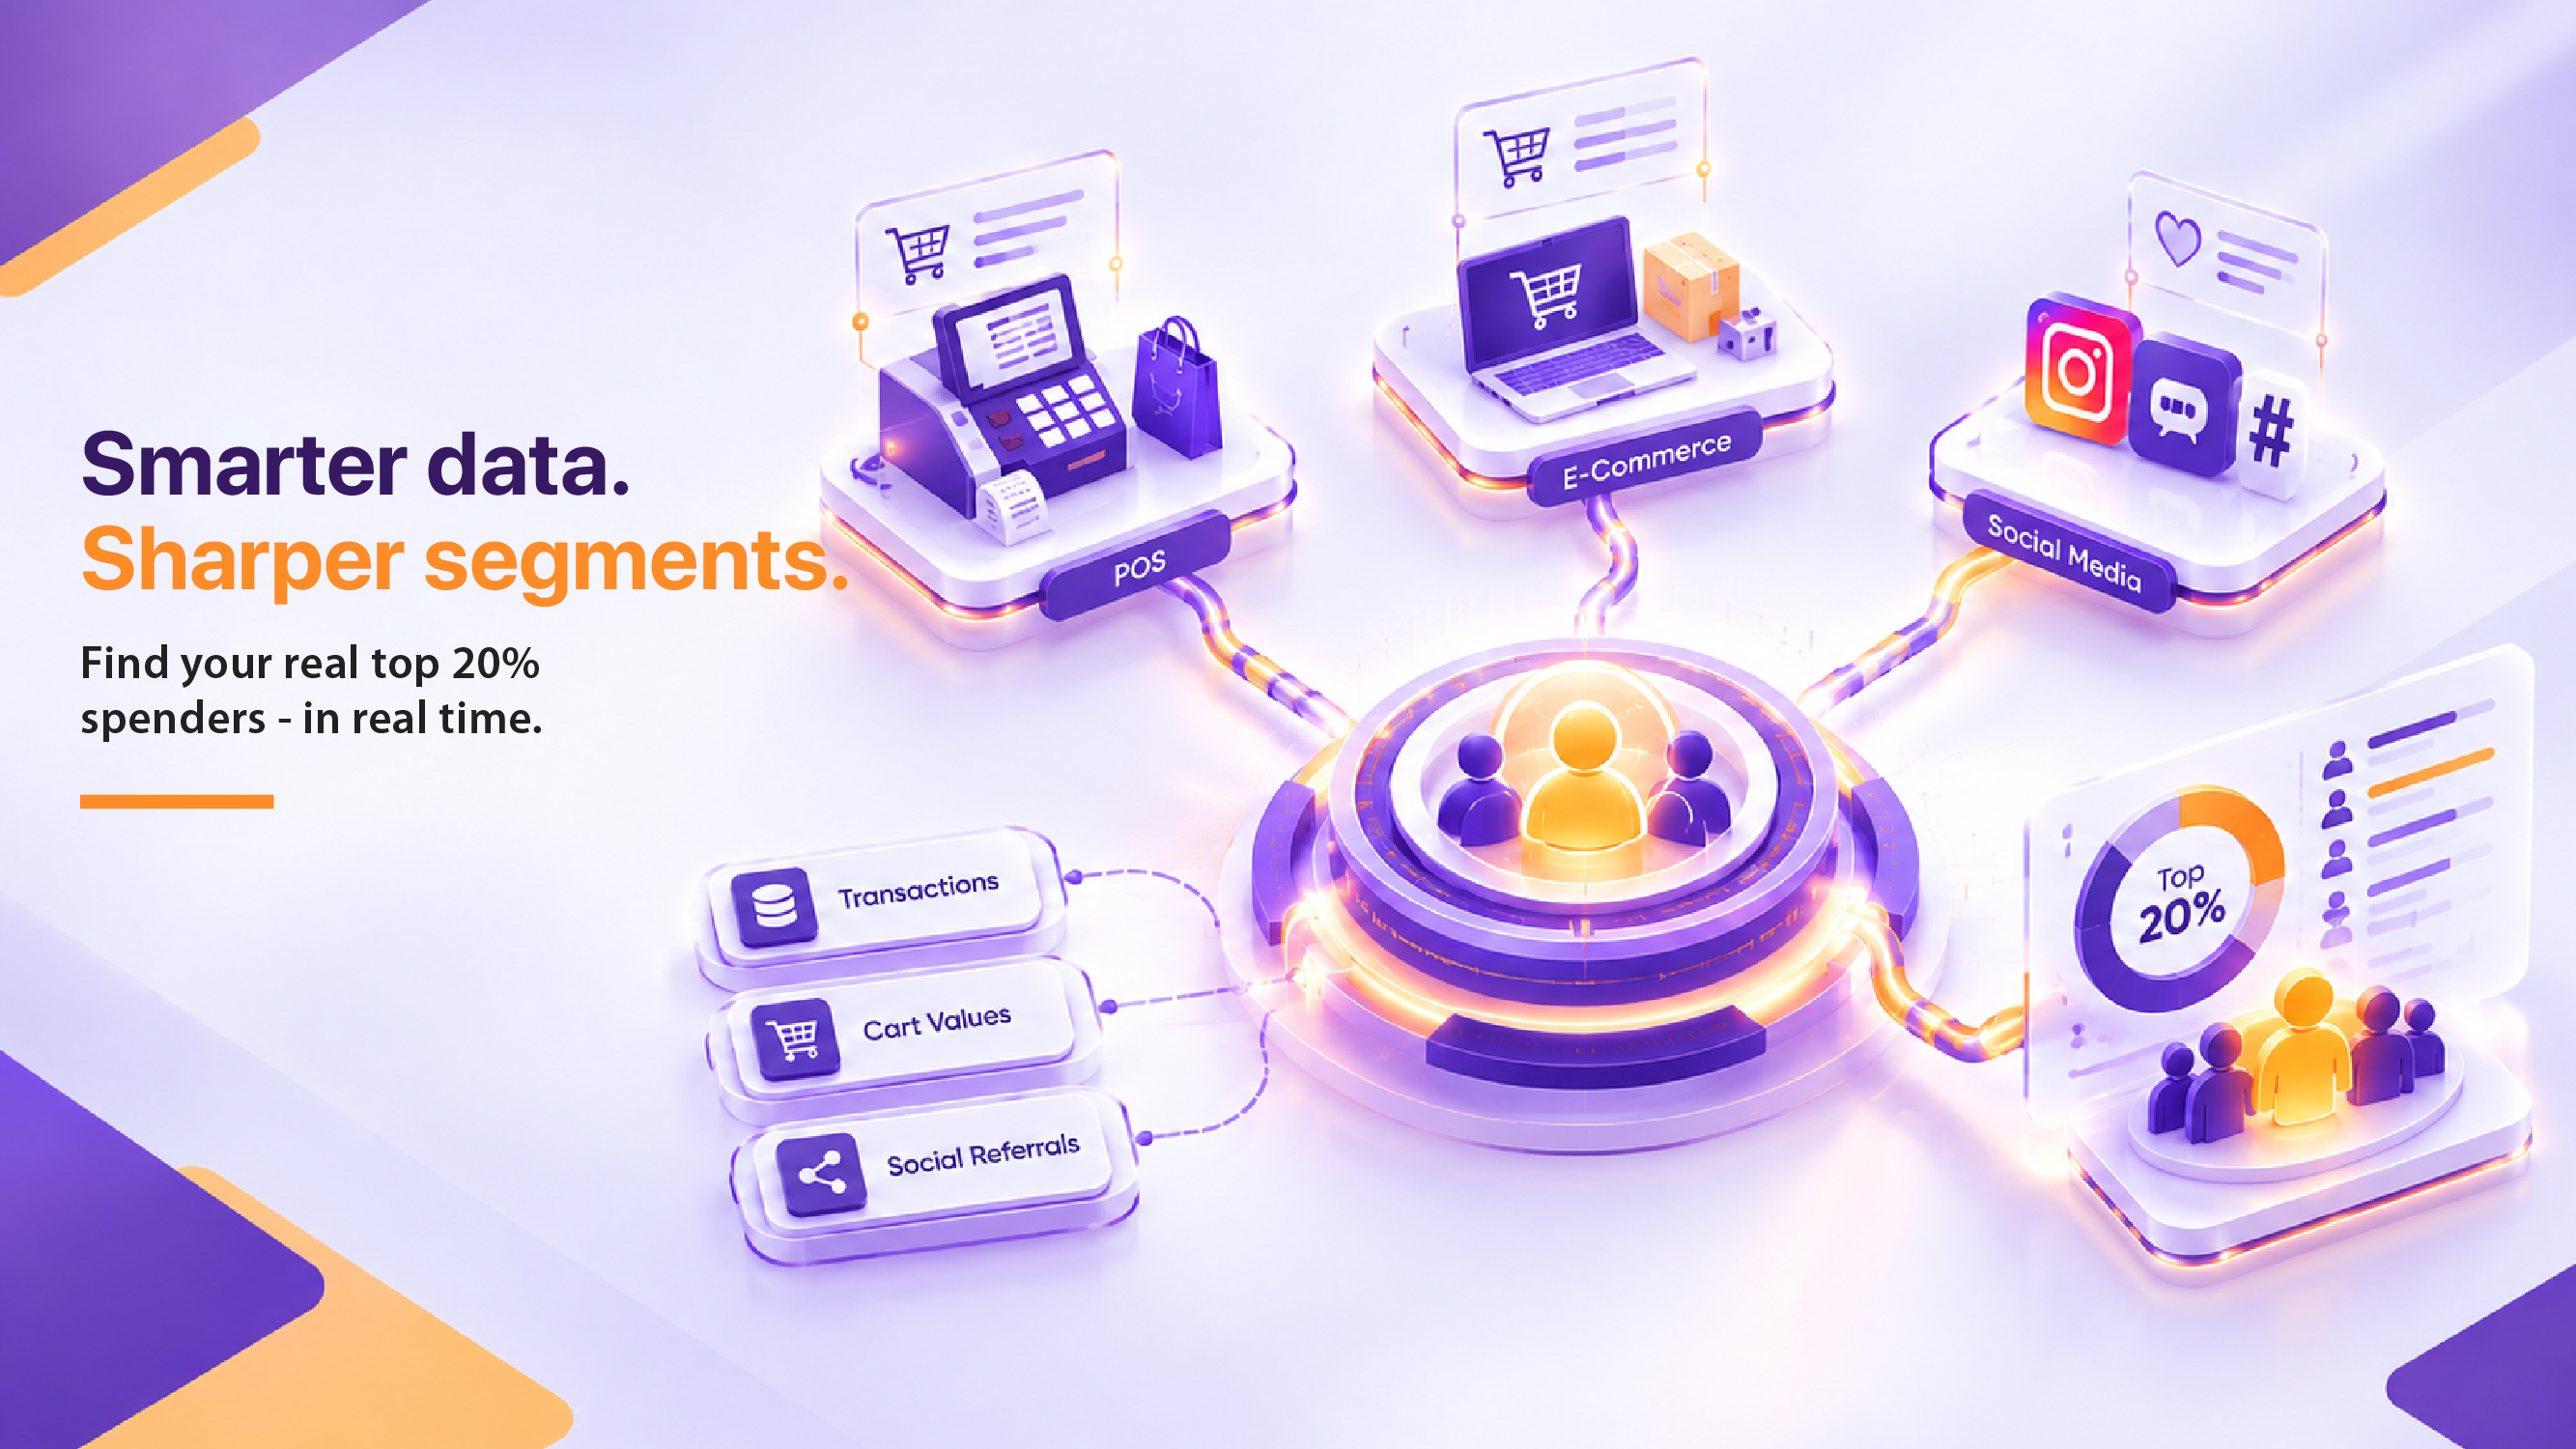
Answer: A static RFM segment freezes customer value at the last month’s snapshot, letting emerging spenders slip through the cracks. In a supermarket chain, a new health‑food line draws affluent shoppers who buy once a month; the static model never promotes them, while the dynamic engine flags them within days.
- Live Cohort Builder
The first pulse of the engine continuously recomputes cohorts based on the fused spend ledger. As soon as a customer crosses a spend threshold, the system tags them as a “Potential Top 20%”. This happens whether the purchase is made via WhatsApp order, in‑store cash, or a click‑and‑collect pickup.
- Behavioral Drift Detector
The second pulse monitors shifts in frequency and recency. If a previously low‑frequency shopper suddenly increases basket size during a regional festival, the detector raises an alert. The CRM head receives a push notification on the dashboard, prompting a timely outreach.
- Predictive LTV Scorer
The third pulse projects lifetime value using machine‑learning models trained on multi‑channel spend patterns. It surfaces customers whose projected LTV places them in the top 20% even before they reach that spend level, allowing proactive engagement.
Action: Install a real‑time segmentation dashboard that highlights emerging high‑value cohorts and routes them to the next step of the Value Map.
Targeted Value‑Creation Tactics: Personalized offers and exclusive experiences drive retention among the identified 20%

Answer: Generic discount coupons dilute brand equity and fail to reward the true spenders; instead, exclusive experiences and tiered privileges keep the top 20% engaged. A beauty brand launches a private launch event for its premium line, inviting only customers flagged by the Value Map, and sees repeat visits without a price cut.
- Tiered Incentive Design
The first pulse crafts a three‑tier reward structure aligned with the Value Map’s spend tiers. Tier 1 receives early access to limited‑edition products, Tier 2 gets a personal stylist chat, and Tier 3 enjoys a complimentary service upgrade. Each tier is linked to a specific spend bracket identified by the dynamic engine.
- Experience‑First Communication
The second pulse shifts messaging from “save X%” to “experience Y”. WhatsApp messages invite top spenders to a backstage tour of the flagship store during the Diwali launch, while email delivers a curated lookbook based on their recent high‑ticket purchases.
- Feedback Loop Integration
The third pulse captures post‑experience sentiment via quick surveys and social listening, feeding the data back into the Signal Fusion Layer. Positive feedback reinforces the customer’s tier, while negative signals trigger a retention play.
Action: Roll out a tiered incentive program that replaces blanket discounts with curated experiences for the top spenders identified by The 3‑Pulse Value Map.
Real‑World Indian Retail Scenario: Uncovering Hidden Top 20% Spenders in a Multi‑Channel Apparel Brand
Imagine a mid‑size apparel brand that operates both a network of boutique stores in tier‑1 cities and an online storefront that ships nationwide. The brand has a loyalty program that rewards points for every rupee spent, but the program is optional and many high‑ticket shoppers prefer to pay cash in‑store to avoid sharing personal data.
During the festive season, the brand notices a sharp rise in sales of its premium silk collection. The online dashboard, however, flags the campaign as under‑performing because the loyalty‑point accruals remain low. By applying The 3‑Pulse Value Map, the retailer pulls together three streams of data:
- POS spend data: Cash registers capture the full transaction value of each silk suit sold, regardless of loyalty enrollment.
- Online order data: The e‑commerce platform records high‑value gift orders placed by corporate clients for employee appreciation.
- Social signals: Instagram posts featuring customers wearing the silk collection generate a surge of brand‑related hashtags and positive comments.
When these signals are fused, a heat map emerges that highlights a cluster of shoppers who consistently purchase the silk line but never appear in the loyalty report. The dynamic segmentation engine immediately tags these shoppers as “Potential Top 20% spenders.” The brand then reaches out with a personalized invitation to an exclusive runway preview, offering a bespoke tailoring session. The result is a deeper relationship with the hidden high‑value cohort, turning occasional cash shoppers into brand advocates.
Implementation Framework: Applying The 3‑Pulse Value Map Step‑by‑Step
To translate the concept into practice, follow this structured framework:
- Data Acquisition (Pulse 1 – Signal Fusion): Connect your POS, e‑commerce, and social listening tools to a central data lake. Use event‑driven APIs to stream transaction totals, cart values, and social engagement metrics in near real‑time.
- Contextual Enrichment (Pulse 2 – In‑Store Heat Mapping): Deploy foot‑traffic sensors, QR‑code scanners, and cashier annotations to capture non‑transactional cues such as dwell time and cash‑only purchases. Feed this layer into the heat‑mapping engine to add behavioral depth.
- Intent Overlay (Pulse 3 – Social Sentiment): Apply natural‑language processing to brand‑related social content, extracting sentiment scores and intent indicators. Tag each customer profile with a sentiment weight that reflects willingness to spend on premium categories.
- Real‑Time Segmentation: Feed the enriched spend ledger into the Live Cohort Builder. Configure spend thresholds that align with your definition of the top 20% spenders. Enable the Behavioral Drift Detector to surface sudden changes in basket size or purchase frequency.
- Predictive Scoring: Train a machine‑learning model on historical multi‑channel spend patterns to predict lifetime value. Use the Predictive LTV Scorer to surface “future top 20% spenders” before they reach the spend threshold.
- Activation & Experience Design: Map each segment to a tier in the Tiered Incentive Design. Craft experience‑first communications that highlight exclusive events, early product access, or personalized services.
- Feedback Integration: After each interaction, capture sentiment via quick surveys and social listening. Feed this feedback back into the Signal Fusion Layer to continuously refine the spend profiles and adjust tier assignments.
- Governance & Monitoring: Establish a real‑time dashboard that visualizes cohort health, drift alerts, and LTV projections. Set up automated alerts for any deviation in the top 20% spenders’ engagement metrics.
By progressing through these eight steps, you create a self‑reinforcing loop where data, insight, and experience continuously elevate the identification and nurturing of your top 20% spenders.
Deepening the Prerequisites Section
Before you activate The 3‑Pulse Value Map, ensure your POS systems export transaction totals in real time, your e‑commerce platform provides order APIs, and your social listening tools can surface brand‑specific mentions instantly. Additionally, verify that your data warehouse can handle high‑velocity streams without latency, as the value of the three pulses diminishes if the information arrives delayed. Secure the necessary data‑privacy consents from customers, especially when aggregating offline cash purchases with online identifiers; this safeguards compliance and builds trust.
Technical readiness also includes establishing a unified customer identifier (UCI) that ties together in‑store receipts, online accounts, and social profiles. Without a reliable UCI, the fusion layer will generate fragmented views, causing the segmentation engine to miss the true top 20% spenders. Finally, allocate cross‑functional ownership: a data engineering lead to manage pipelines, a marketing analyst to define spend thresholds, and a CX manager to design the exclusive experiences. This collaborative foundation ensures that each pulse of the Value Map operates with accurate, timely, and actionable data.
Frequently Asked Questions
1. How can I accurately identify my top 20% spenders?
Start by segmenting customers based on their transaction history across all channels, then apply a Pareto analysis to isolate the segment that consistently generates the highest revenue. Cross‑reference this list with loyalty program data to ensure you’re capturing repeat high‑value shoppers.
2. What data sources should I integrate to get a complete view of top spenders?
Combine point‑of‑sale receipts, online purchase logs, and omnichannel loyalty points. Include customer service interactions and returns history to filter out one‑time high spenders who may not be repeat business.
3. How often should I refresh my top 20% list?
Review the list quarterly to capture seasonal shifts and new product launches. A monthly check during peak shopping periods can help you react quickly to emerging high‑value customers.
4. What actions can I take once I’ve identified these top spenders?
Offer personalized incentives such as exclusive early access to new collections, tailored discounts, or dedicated account managers. Use targeted marketing campaigns that highlight premium product lines and value‑added services.
5. How can I ensure my marketing budget is focused on these top spenders?
Allocate a higher proportion of your media spend to channels that historically drive traffic from high‑value shoppers, such as direct email, personalized SMS, and loyalty‑app notifications. Track engagement to refine targeting over time.