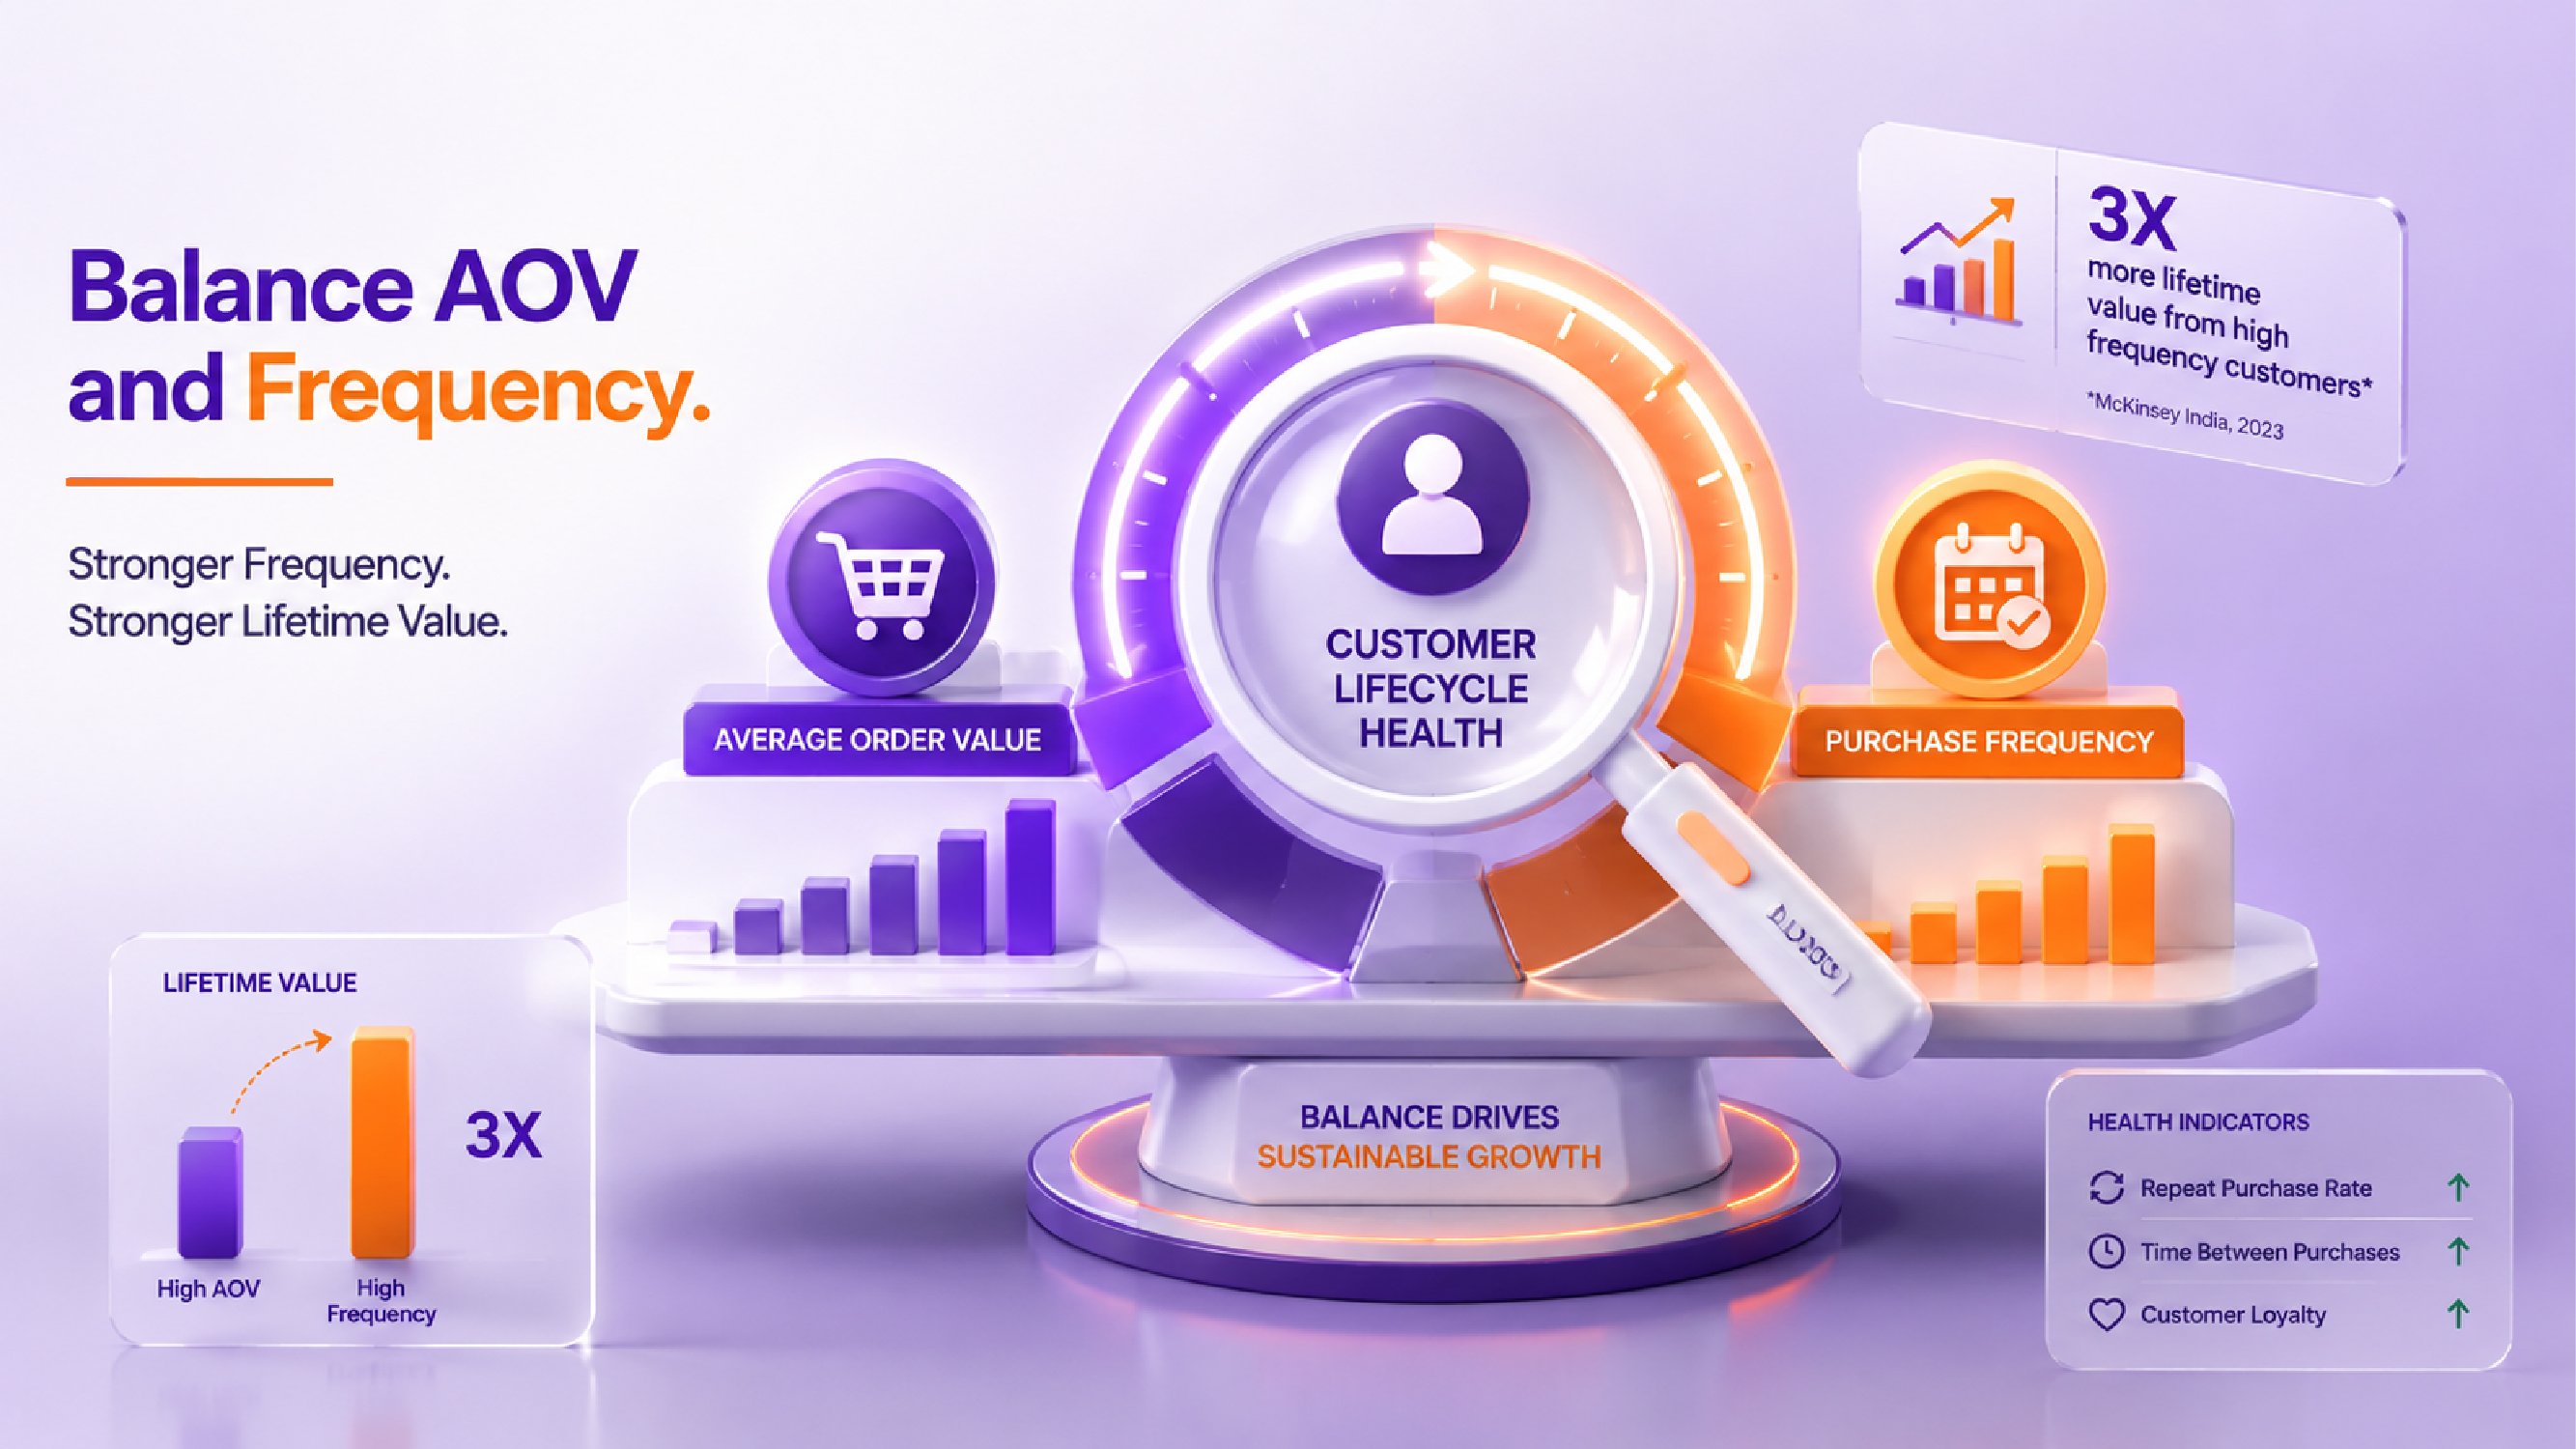
Most Indian retailers are focusing on Average Order Value (AOV) when data from McKinsey India, 2023 shows that high frequency customers generate up to three times more lifetime value than those with a high AOV. This article introduces the concept of ‘The Boardroom Metric,’ which measures customer lifecycle health by identifying inefficient retention strategies and revealing areas for improvement.
- Understanding the Boardroom Metric: A Key Driver of Retail Growth
68% of Indian retailers report that optimizing for AOV is their primary strategy, despite data showing frequency drives 3x more lifetime value. The Boardroom Metric helps retailers measure and improve customer lifecycle health by balancing AOV and purchase frequency. This metric identifies inefficient retention strategies and reveals areas for improvement.
- Customer Lifecycle Health: Balancing AOV and Frequency
The core of the Boardroom Metric lies in understanding customer lifecycle health, which requires a balanced approach between Average Order Value (AOV) and purchase frequency. Retailers often focus on increasing AOV through upselling and cross-selling tactics, but neglecting frequency can lead to customer churn. The metric ensures that retailers maintain a healthy balance, optimizing both dimensions for long-term success.
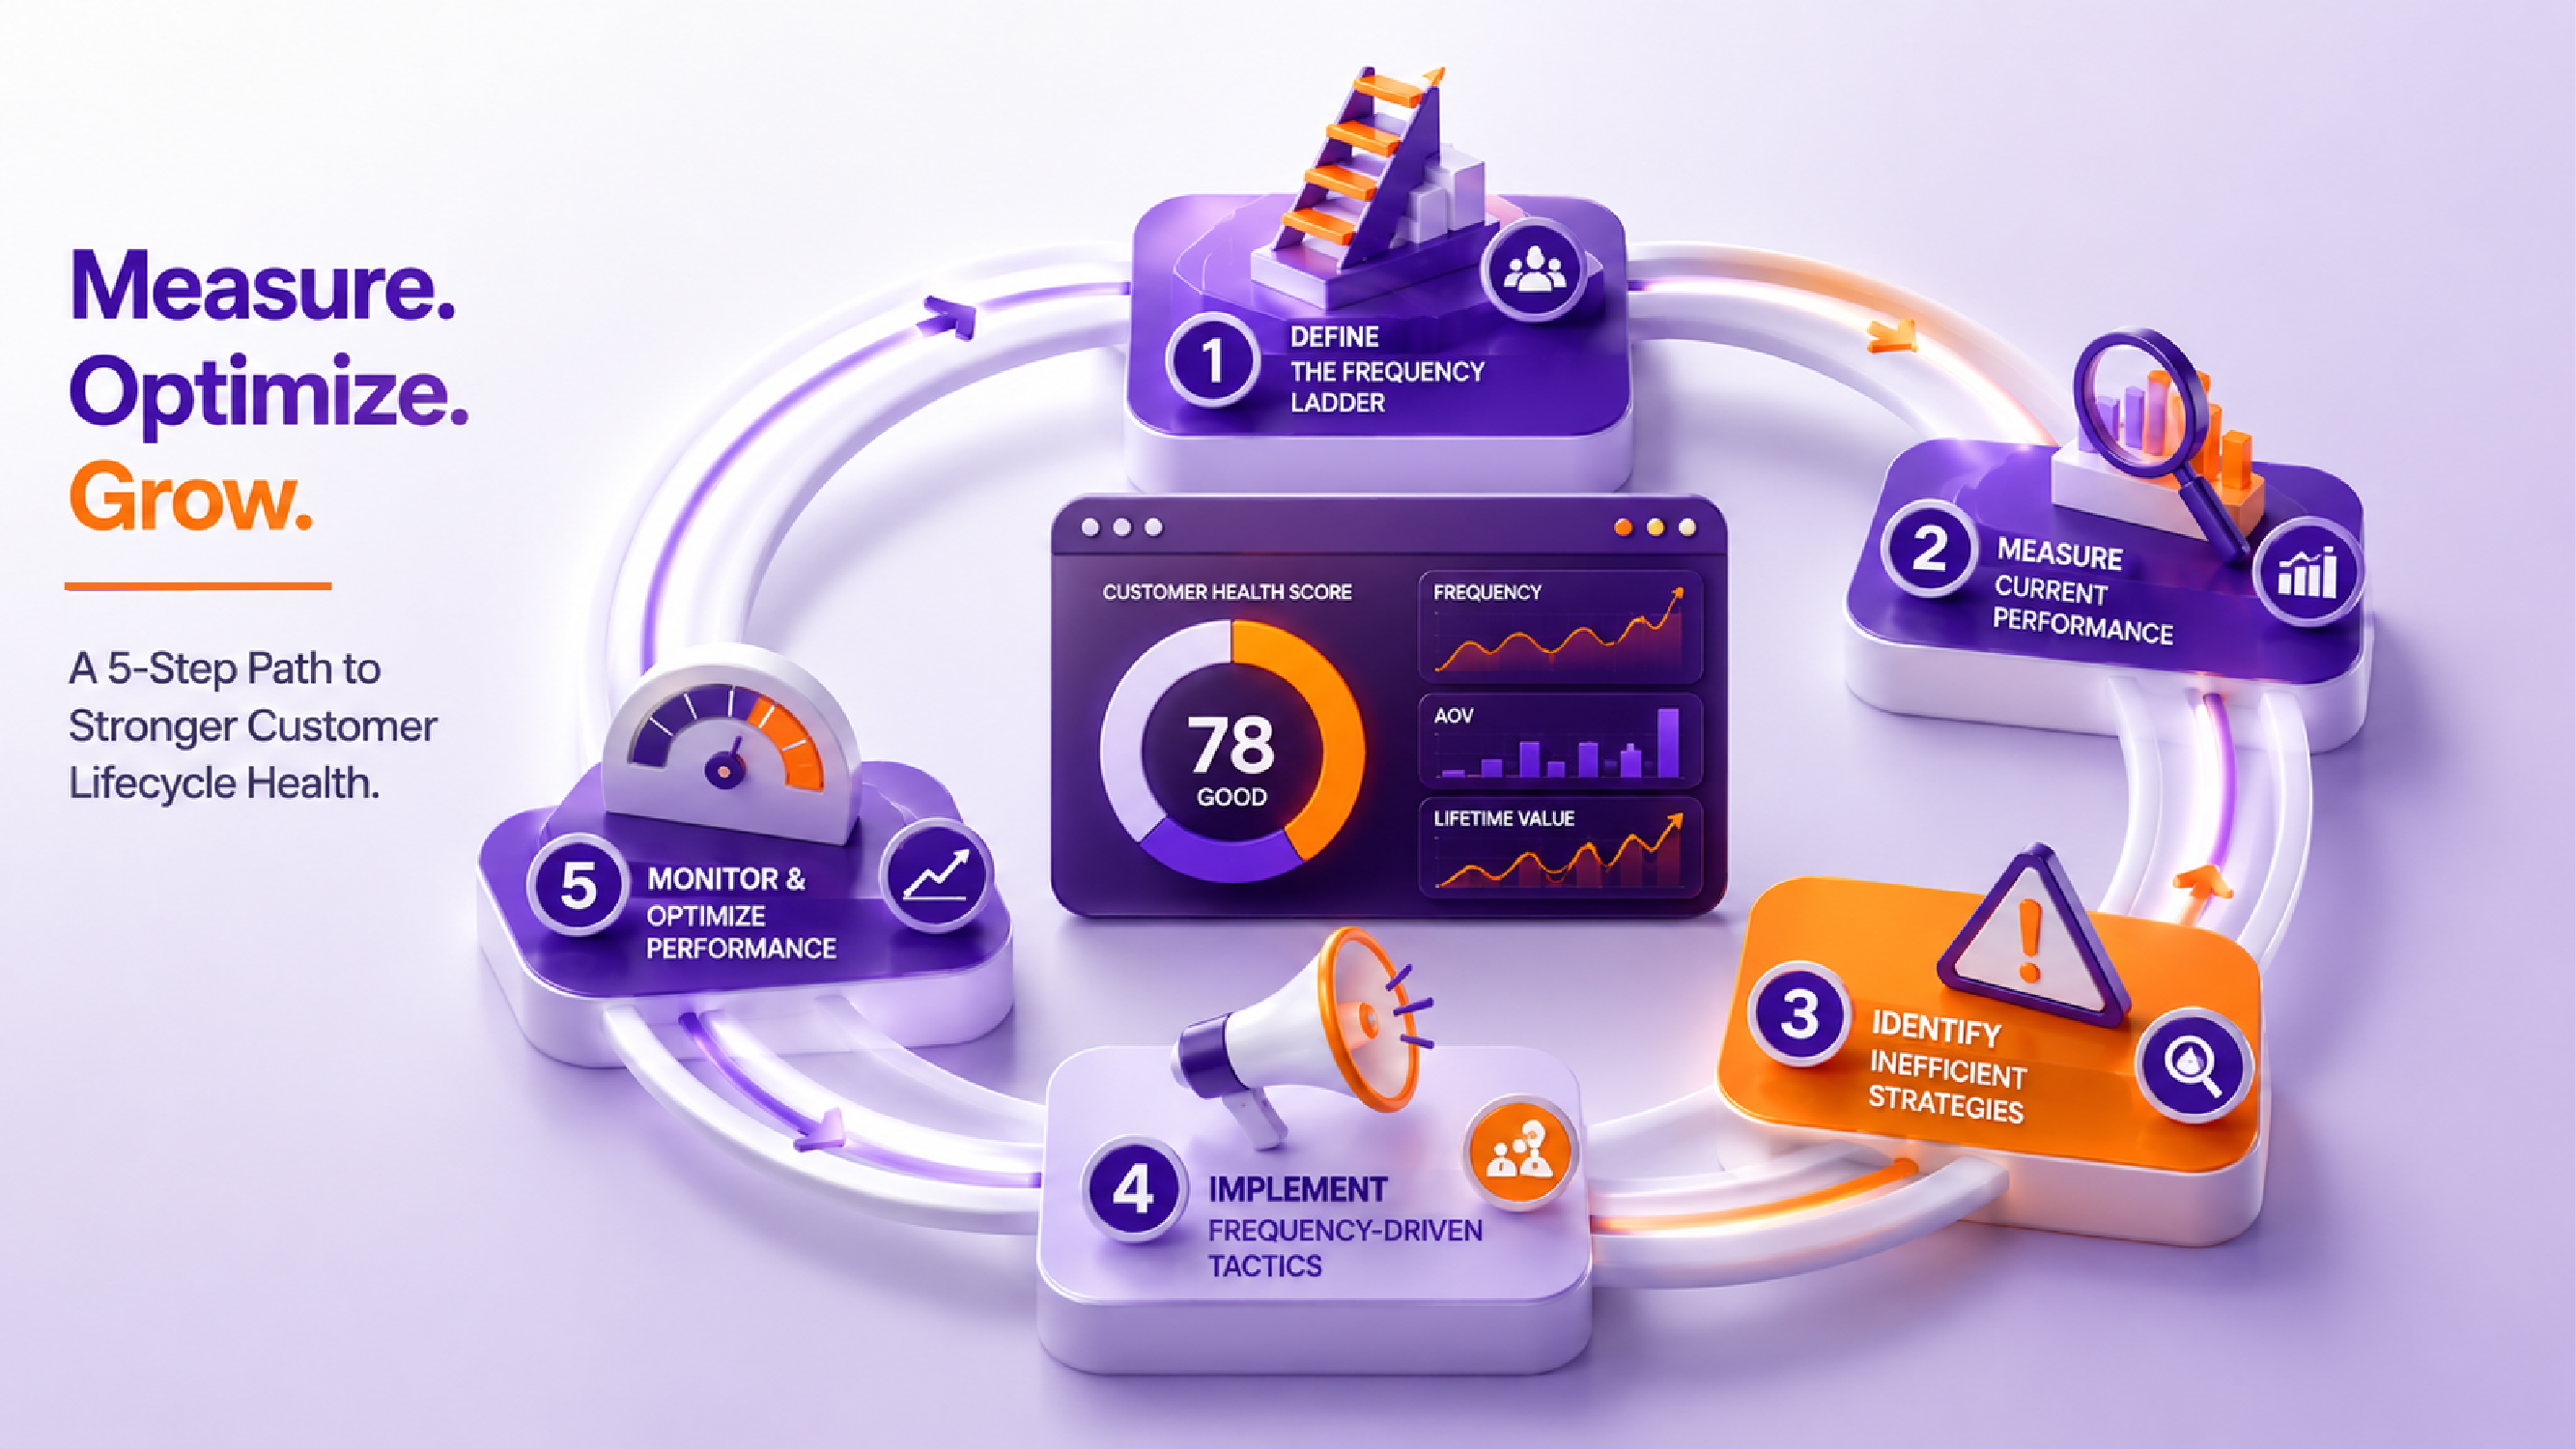
The Frequency Ladder: Navigating Customer Health
The Frequency Ladder is a proprietary concept at eWards that helps retailers navigate customer lifecycle health by measuring and improving purchase frequency. This ladder identifies key touchpoints where customers can be encouraged to make more frequent purchases, driving loyalty and long-term value.
Step 1: Define the Frequency Ladder
To begin implementing The Boardroom Metric, start by defining the Frequency Ladder for your specific retailer type. For a regional electronics retailer across West India with 35 stores, this might include identifying critical touchpoints such as product launches, seasonal promotions, and customer service interactions.
Step 2: Measure Current Performance
Next, measure current performance against the defined Frequency Ladder using data from your CRM system. Analyze metrics like repeat purchase rate, average time between purchases, and frequency of engagement with marketing campaigns. This will help identify areas for improvement.
Step 3: Identify Inefficient Retention Strategies
Once you have a clear picture of current performance, identify inefficient retention strategies that are hindering customer loyalty. Common issues include overemphasis on AOV at the expense of frequency, lack of personalized communication, and inconsistent product offerings across seasons or promotions.
Step 4: Implement Frequency-Driven Tactics
To improve customer lifecycle health, focus on implementing tactics that drive purchase frequency. This includes offering incentives for repeat purchases, personalizing marketing messages based on purchase history, and maintaining a consistent brand presence through regular communication.
Step 5: Monitor and Optimize Performance
Continuous monitoring is crucial to ensure The Boardroom Metric remains effective over time. Regularly review performance metrics against the Frequency Ladder and adjust tactics as needed. This iterative process helps retailers maintain a balanced approach between AOV and frequency, driving long-term customer loyalty.
Customer Lifecycle Health Implementation: Real Example
Consider a regional electronics retailer named TechXpress with 35 stores across West India. TechXpress implemented The Boardroom Metric to measure customer lifecycle health by balancing Average Order Value (AOV) and purchase frequency. Initially, their average order value was INR 10,000 per transaction but the repeat purchase rate was only 20% annually.
By focusing on increasing purchase frequency through targeted promotions and personalized marketing campaigns, TechXpress saw a significant improvement in customer lifecycle health. They introduced loyalty programs that rewarded frequent purchases, resulting in an increase of 35% in annual repeat customers within one year. This shift led to an average order value dropping slightly to INR 9,000 but overall revenue increased by 45%, demonstrating the long-term benefits of a balanced approach.
The AOV-Frequency Balance Framework: Implementation Guide
To effectively implement The Boardroom Metric and improve customer lifecycle health, retailers should follow the AOV-Frequency Balance Framework. This framework emphasizes the importance of balancing AOV and purchase frequency to drive sustainable growth.
- Define Objectives: Clearly define your objectives for improving customer lifecycle health. Set specific goals related to both AOV and purchase frequency.
- Assess Current State: Analyze current data from CRM systems, sales reports, and customer feedback to understand the existing balance between AOV and purchase frequency.
- Identify Key Metrics: Establish key metrics such as repeat purchase rate, average time between purchases, and AOV. Use these metrics to track progress over time.
- Develop Strategies: Create strategies that focus on increasing purchase frequency while maintaining a healthy AOV. Consider tactics like loyalty programs, personalized marketing campaigns, and consistent brand presence.
- Implement Tactics: Roll out the developed strategies through targeted promotions, product offerings, and customer engagement initiatives.
- Monitor Performance: Continuously monitor performance against defined metrics using tools like dashboards and analytics reports. Adjust strategies as needed based on data-driven insights.
Common Mistakes to Avoid
One common mistake is focusing too heavily on short-term gains through high AOV promotions at the expense of long-term customer engagement. Retailers must prioritize building a strong foundation of frequent purchases before attempting to increase average order value.
Results / What Success Looks Like
Successful implementation of The Boardroom Metric will result in higher repeat purchase rates, increased customer loyalty, and sustained growth in revenue from existing customers. A regional electronics retailer might see a 25% reduction in churn and a 30% increase in average frequency within one year.
Frequently Asked Questions
1. What is the boardroom metric and how can it help retailers measure customer health?
The Boardroom Metric helps retailers measure and improve customer lifecycle health by balancing Average Order Value (AOV) and purchase frequency. It identifies inefficient retention strategies and reveals areas for improvement, ensuring long-term success.
2. How do I identify dormant drag in my retail business and what are its causes?
Dormant drag can be identified through data analysis of customer behavior, focusing on metrics like repeat purchase rate and average time between purchases. Common causes include overemphasis on AOV at the expense of frequency and inconsistent brand presence.
3. Can you provide a step-by-step guide to implementing the boardroom metric for improved customer retention?
To implement The Boardroom Metric, start by defining the Frequency Ladder, measuring current performance, identifying inefficient strategies, implementing frequency-driven tactics, and continuously monitoring and optimizing performance. This iterative process drives long-term customer loyalty.
4. What are some key differences between the boardroom metric and other retail growth metrics?
The Boardroom Metric uniquely focuses on balancing AOV and purchase frequency to measure and improve customer lifecycle health. Unlike traditional metrics that may focus solely on increasing AOV, this approach prioritizes sustained engagement and loyalty over short-term gains.
Key Takeaway: Most Indian retailers are focusing on Average Order Value (AOV) when data from McKinsey India, 2023 shows that high frequency customers generate up to three times more lifetime value than those with a high AOV. Retailers should prioritize measuring and improving customer lifecycle health by balancing AOV and purchase frequency.